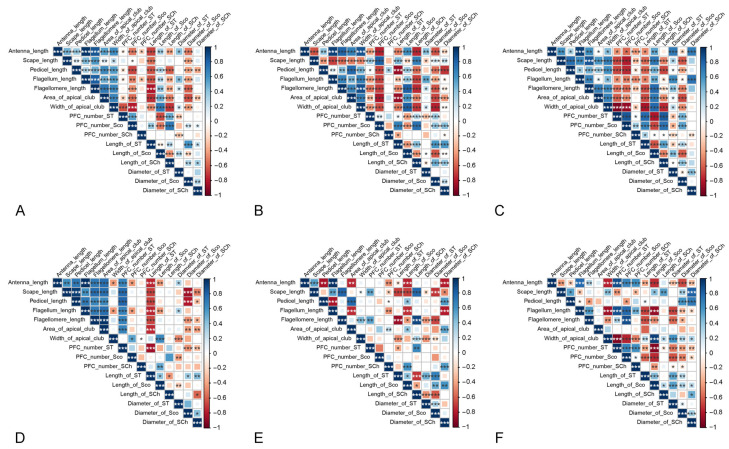
Figure 7.
The correlation between morphological characteristics of the antenna. (A) In the three Danaus species. (B) In males. (C) In females. (D) In D. chrysippus. (E) In D. genutia. (F) In D. plexippus. The area and color of the squares indicate the strength of the correlations. The stronger the correlation, the larger the square and the deeper its color. Squares are blue when the correlation is positive and red when the correlation is negative. The ‘*’ indicates significance at the 0.05 level. ‘**’ indicates significance at the 0.01 level. ‘***’ indicates significance at the 0.001 level.

