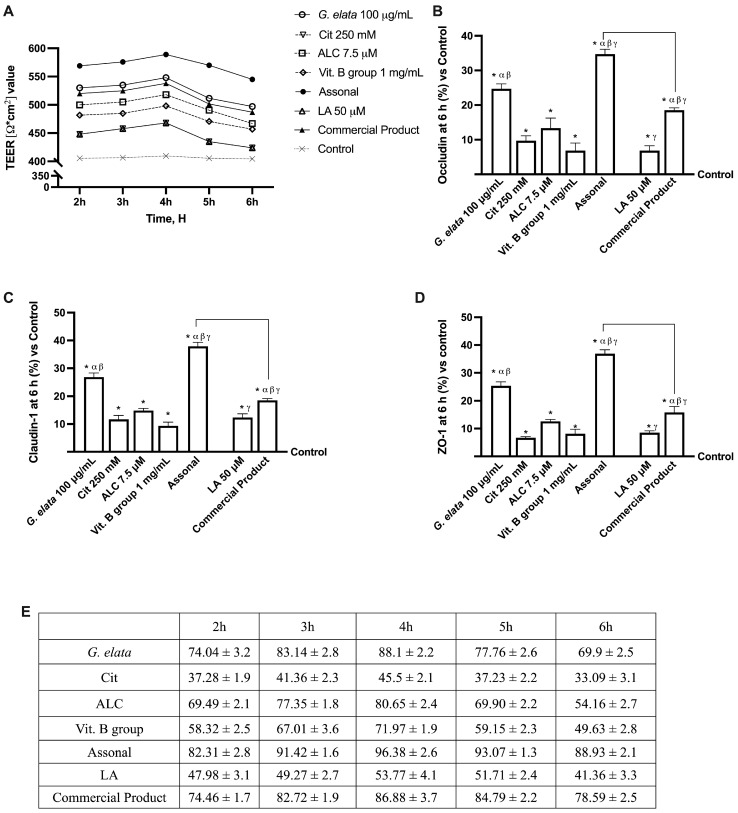
Figure 3.
Permeability study on CaCo-2 cells. (A) TEER (transepithelial electrical resistance) Value using EVOM3 during the time (from 2 h to 6 h); (B–D) the analysis of TJ measured by Enzyme-Linked Immunosorbent Assay (ELISA) test (Occludin, Claudin-1, and ZO-1, respectively) at 6 h; (E) the absorption rate during time (from 2 h to 6 h) obtained from the application of following formula: J = Jmax [C]/(Kt + [C]). The abbreviations are the same as reported in Figure 2. In (A), data are expressed as means ± SD of five independent experiments. From (B–D), means ± SD are expressed comparing data to the control (0% line) of five independent experiments performed in triplicates, and all molecules result in * p < 0.05 vs. control; α p < 0.05 vs. Cit, ALC, and Vit. B group; β vs. LA; γ vs. G. elata; the bars p < 0.05 vs. commercial product.

