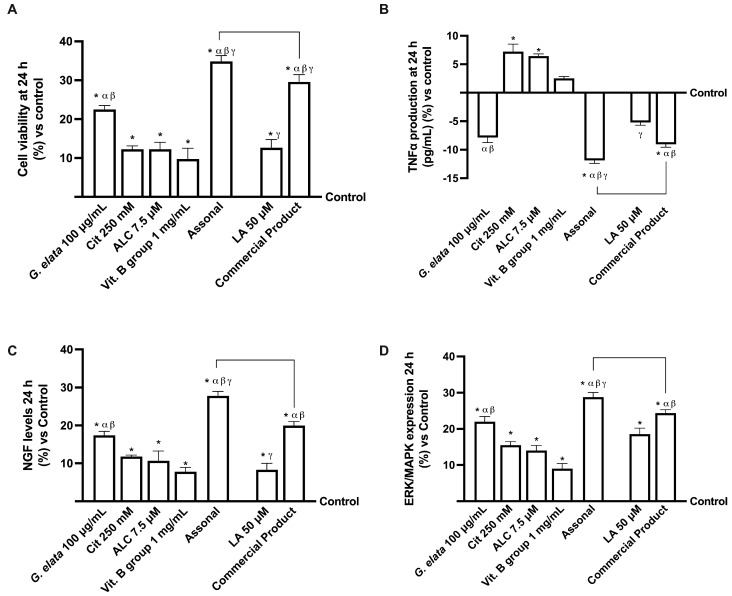
Figure 4.
Analysis of 3D EngNT in physiological conditions. In (A), cell viability is measured by the MTT test; (B), TNFα, (C), NGF, and (D), pERK/MAPK are measured by the ELISA kit. The data obtained at 24 h of stimulation are expressed as mean ± SD of five independent experiments performed in triplicate and normalised to control values (0% line). The abbreviations are the same as reported in Figure 2. * p < 0.05 vs. control; α p < 0.05 vs. Cit, ALC, and Vit. B group; β vs. LA; γ vs. G. elata; the bars p < 0.05 vs. commercial product.

