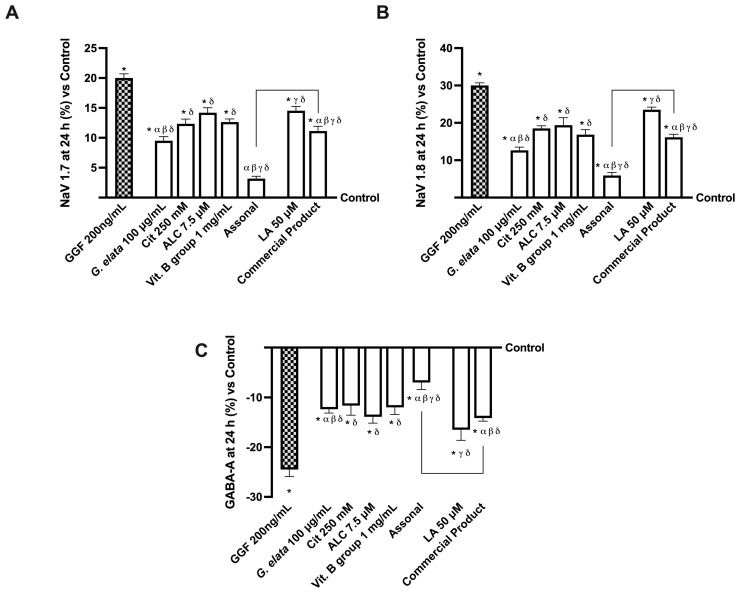
Figure 6.
Analysis of single agents and combinations on NaV channels and GABA level under PNI conditions at 24 h of stimulation. In (A), Nav 1.7; in (B), Nav 1.8; in (C), GABA-A. All these tests were performed with a specific ELISA kit. The data are expressed as means ± SD (%) of five independent experiments performed in triplicate and normalised to control values (0% line). The abbreviations are the same as reported in Figure 5. * p < 0.05 vs. control; α p < 0.05 vs. Cit, ALC, and Vit. B group; β vs. lipoic acid; γ vs. G. elata; δ p < 0.05 vs. GGF 200 ng/mL; the bars p < 0.05 vs. commercial product.

