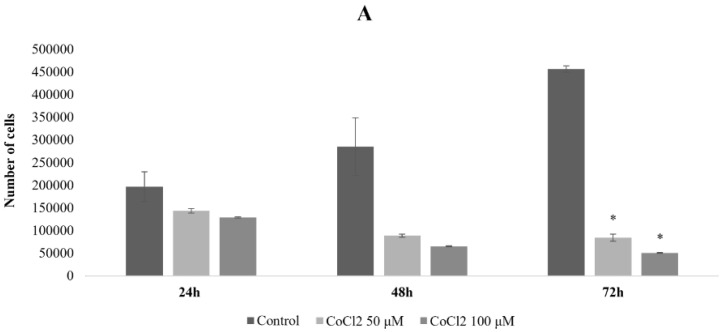
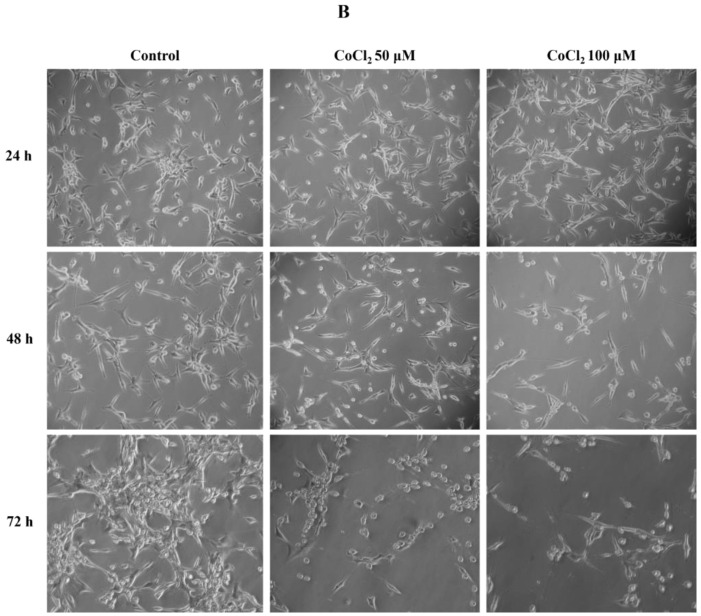
Figure 1.
Cell counts of U87 cells untreated and treated with 50 and 100 μM CoCl2. On the abscissa axis, the origin for the hours corresponds to the start of the treatment (A). Micrographs of U87 cells at 24, 48, and 72 h post-treatment with 50 and 100 μM CoCl2 (magnification 10×) (B). The data shown are representative of two independent experiments and are expressed as the mean ± standard deviation of the mean (SD). The significance level compared to the control sample, for each time point, was set to p < 0.05 (unpaired t-test Welch corrected) and displayed with the asterisk (*).


