
Figure 3.
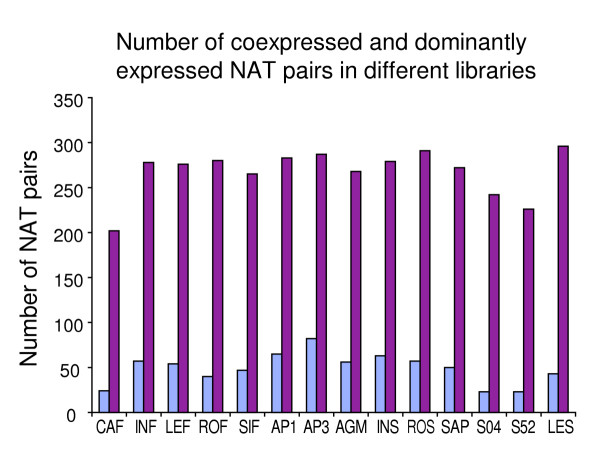
Distribution of coexpressed and dominantly expressed NAT pairs in different libraries. The number of coexpressed NAT pairs in each library was shown in blue bar and that of dominantly expressed NAT pairs in red bar. See legend of Table 5 for library information.