
Figure 1.
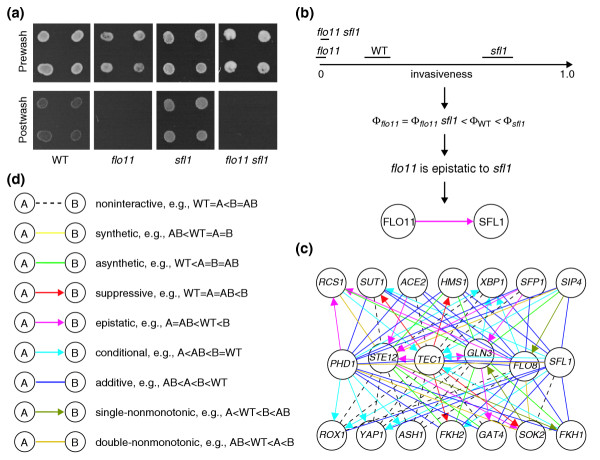
Application of the method to yeast agar invasion data to derive a genetic-interaction network. (a) Pre-wash and post-wash images of example genotypes in a yeast agar-invasion assay. (b) The invasion data shown on a phenotype axis with replicate-measurement error ranges, as a phenotype inequality, as a genetic-interaction mode, and as a graphical visualization. (c) Part of the network (only transcription factor genes) is shown. Nodes represent perturbed genes; edges represent genetic interactions. A key to the interactions is given in (d). (d) Graphical visualizations of genetic interaction modes and asymmetries, and example phenotype inequalities.