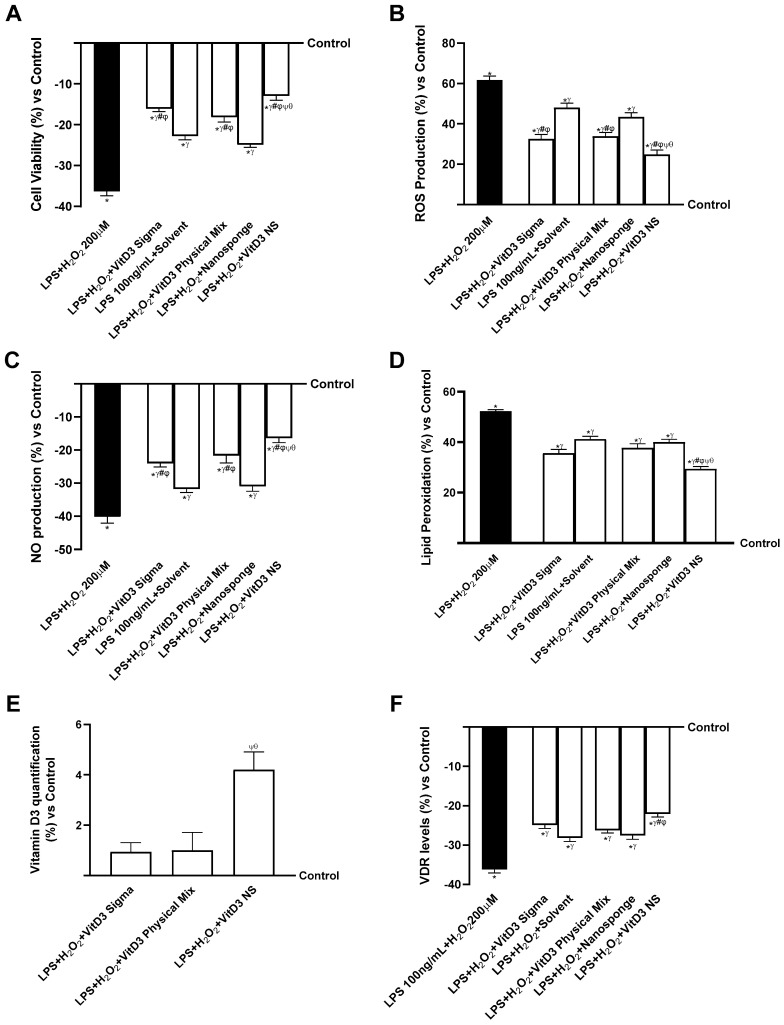
Figure 5.
The effects of VitD3 NS on IBS gut/degenerative brain axis. In (A), cell viability is measured by the MTT test; in (B), ROS production is measured by Cytochrome C reduction; in (C), NO production is measured by a specific Assay Kit; in (D), lipid peroxidation analyzed by a specific assay kit; in (E), Vitamin D3 quantification measured by ELISA Kit; and in (F), VDR quantification evaluated by ELISA Kit. Data are expressed as mean ± SD (%) of 5 independent experiments normalized to control. * p < 0.05 vs. control; γ p < 0.05 vs. LPS 100 ng/mL + H2O2 200 µM; # p < 0.05 vs. solvent (ethanol); φ p < 0.05 vs. nanosponge; ψ p < 0.05 vs. VitD3 Sigma; θ p < 0.05 vs. VitD3 Physical Mix 100 nM.

