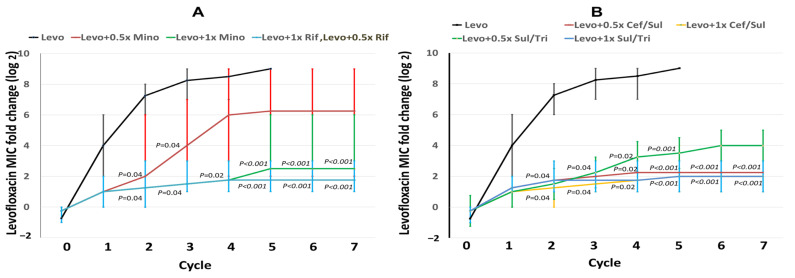
Figure 1.
Fold changes in fluoroquinolone minimum inhibitory concentrations (MICs) in selected E. anophelis mutants. Four wild-type isolates were used as parent strains to be exposed to levofloxacin or its combination with minocycline (A), rifampin (A), cefoperazone/sulbactam (B), and sulfamethoxazole/trimethoprim (B) in a stepwise manner. The x-axis numbers represent the cycles of induction and selection. The y-axis numbers indicate the average (lines) and range (vertical bars) of MIC fold changes (log2) in each cycle. The p value indicates the difference in MIC distributions between exposure to levofloxacin alone and the levofloxacin combination within the same cycle.

