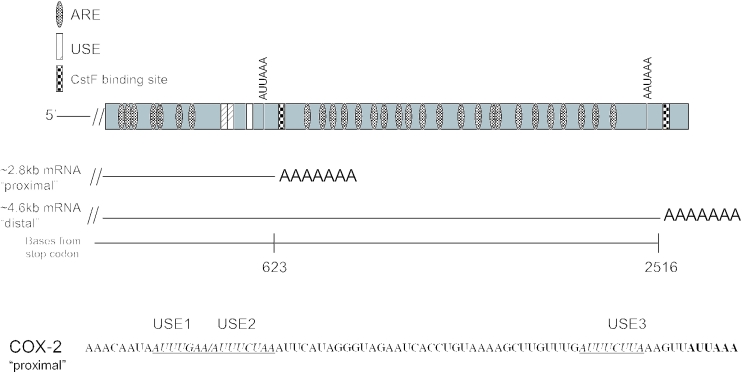
Figure 1.
Schematic representation of the human COX-2 3′-UTR. Diagram of the 3′-UTR of the human COX-2 gene highlighting the major polyadenylation signals; resulting mRNAs are also depicted. Putative auxiliary USEs are represented by hatched boxes; checkered boxes represent CstF binding sites; AREs are represented by dotted ovals. Bottom: sequence of a portion of the COX-2 proximal polyadenylation signal. Putative USEs are italicized, underlined and noted above the sequence.

