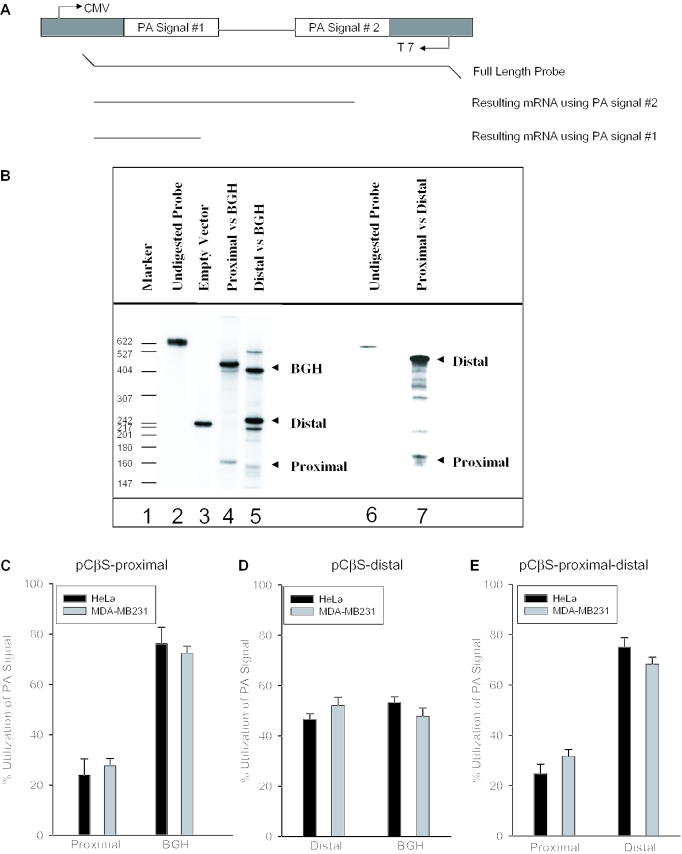
Figure 3.
In vivo polyadenylation assays demonstrate the relative strength of the COX-2 proximal and distal polyadenylation signals. (A) Schematic representation of the pCβS reporter construct used in the in vivo polyadenylation assay. The relative position of each polyadenylation signal is diagramed. The BGH polyadenylation signal is always located at poly(A) site 2. The proximal and distal constructs have those respective sequences cloned into poly(A) site 1. Only the pCβS-proximal-distal-BGH and pCβS-proximal-distal constructs vary from this scheme. (B) Representative RNase protection data for in vivo polyadenylation assays using these constructs. Lane 1, size markers from pBR322 cut with MspI and 5′ end labeled with [γ-32P]ATP as indicated; lane 2, undigested probe; lane 3, pCβS empty vector; lanes 4 and 5, COX-2 constructs in pCβS as indicated above the lane; lane 6, undigested probe; and lane 7, pCβS-proximal-distal. (C) pCβS-proximal was transfected into HeLa (closed bars) or MDA-MB-231 cells (gray bars), RNA was isolated after 24 h, and RNase protection assays were performed. Quantification of three independent experiments is shown here. Constructs are shown on the x-axis; percent use of either the proximal or BGH is shown on the y-axis. The percent utilization was calculated based on the ratio of each signal being utilized within each experiment. Error bars represent SD. All P-values are <1.9 × 10⁻¹³. (D) pCβS-distal was transfected into HeLa (closed bars) or MDA-MB-231 cells (gray bars), RNA was isolated after 24 h, and RNase protection assays were performed. Quantification of three independent experiments is shown here. Constructs are shown on the x-axis; percent use either the distal or BGH polyadenylation signal is shown on the y-axis. The percent utilization was calculated based on the ratio of each signal being utilized within each experiment. Error bars represent SD. All P-values are <0.0008. (E) pCβS-proximal-distal was transfected into HeLa (closed bars) or MDA-MB-231 cells (gray bars), RNA was isolated after 24 h, and RNase protection assays were performed. Quantification of three independent experiments is shown here. Percent use of either the proximal or distal polyadenylation signal is shown on the y-axis. The percent utilization was calculated based on the ratio of each signal being utilized within each experiment. Error bars represent SD. All P-values were <0.005.

