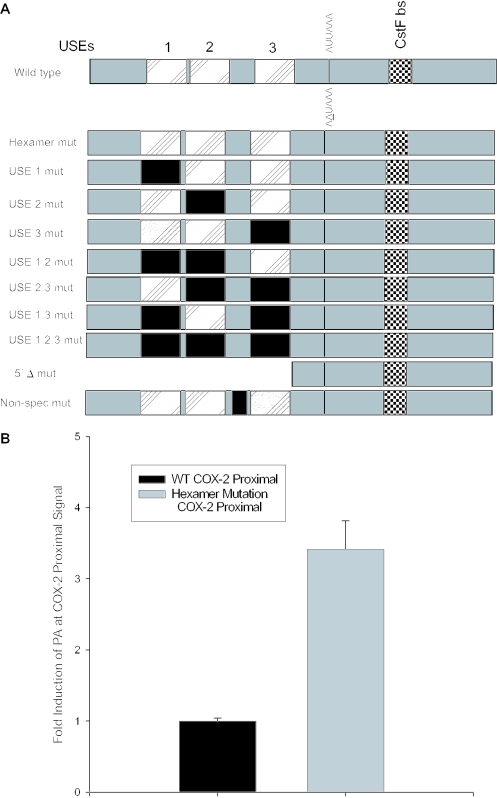
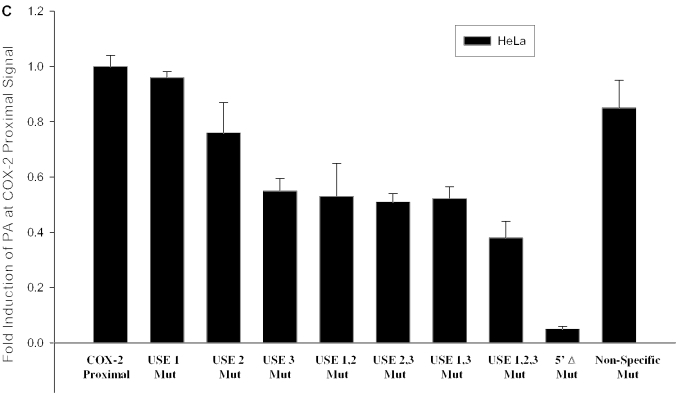
Figure 4.
A positive mutant and mutation of the USEs influence use of the COX-2 proximal polyadenylation signal. (A) Diagram showing COX-2 proximal polyadenylation signal and mutations prepared. Closed rectangles represent mutations; hatched rectangles represent USEs; and checkered boxes represent the CstF binding site. (B) Mutants were prepared of the COX-2 proximal polyadenylation signal by site-directed mutagenesis and were cloned into pCβS, transfected into HeLa cells, RNA was isolated after 24 h, and RNase protection assays were performed. Quantification of four independent experiments is shown here. Constructs are shown on the x-axis; fold-induction of polyadenylation at the COX-2 proximal signal is shown on the y-axis. Error bars represent SD. All P-values were <0.0029. (C) USE single mutants, double mutants and the triple mutant, as well as the 5′Δ mutant were prepared as described, transfected into HeLa cells, RNA was isolated after 24 h, and RNase protection assays were performed. Quantification of three independent experiments is shown here. Constructs are shown on the x-axis; fold-induction of polyadenylation at the COX-2 proximal signal is shown on the y-axis. Error bars represent SD. All P-values were <0.0017.


