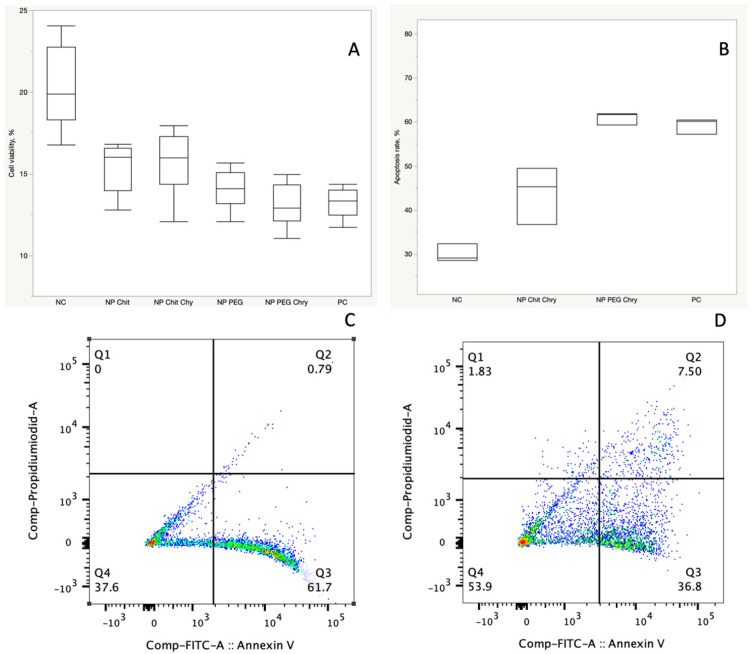
Figure 5.
Cell viability and apoptosis rate under treatment with Fe3O4 NPs coated with PEG and chitosan. (A) Cell viability assessment using the MTT test with a 5 µg/mL treatment of Fe3O4@PEG500 with a 1:1 PEG-chrysin ratio and with 5µg/mL of Fe3O4@Chitosan500 with a 1:1 chitosan-chrysin ratio (PNP_PEG_Chry vs. NP_Chit_Chry = 0.0033). NC = negative control, where no treatment was administered. PC = positive control, where a treatment with 5 μg/mL of pure chrysin was applied. (B) Apoptosis rates following 48 h of treatment with Fe3O4@PEG500 and Fe3O4@Chitosan500 NPs, comparing the effects of coating with PEG versus chitosan. NC = negative control, representing the condition where no treatment was administered, serving as a control group. PC = positive control, representing the positive control group where a treatment of 5 μg/mL of chrysin was applied, serving as a reference for assessing the impact of the treatment with pure chrysin. (C) Representative images from the FACS experiments conducted after 48 h of treatment with Fe3O4@PEG500, inducing apoptosis in 61.7% of cells. (D) Representative images from the FACS experiments conducted after 48 h of treatment with Fe3O4@Chitosan500, inducing apoptosis in 36.8% of cells. Viable cells stain negative for both PI and Annexin V (Q4); early apoptotic cells stain positive for Annexin V and negative for PI (Q3); necrotic cells stain positive for PI only (Q1); and late apoptotic cells stain positive for both Annexin-V and PI (Q2). In order to make the text shorter we decided not include, because the image is self-descriptive.

