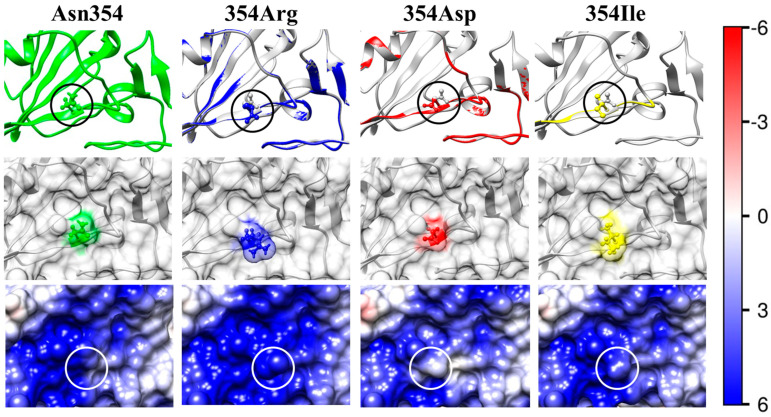
Figure 3.
Structural models and surface electrostatic potential of the wild-type strain (first column, Asn354) and the mutants (second, third, and fourth columns) of the RBD of the S-protein. The pictures show a part of the 3D structure and the surface of RBD in the region of the point mutations (denoted by rings in the first and third rows). The uncharged hydrophilic amino acid residue of the asparagine (Asn, N) at 354th position (numbered from the N-end to the C-end of the polypeptide chain) (first column) of the wild-type S-protein is substituted with the following: (354Arg) a positively charged hydrophilic residue, arginine (Arg, R; the second column); (354Asp) a negatively charged hydrophilic residue, aspartic acid (aspartate, Asp, D; the third column); or (354Ile) an uncharged hydrophobic residue, isoleucine (Ile, I) (the fourth column). The amino acid residues in the second row are colored according to their charge and hydrophilicity: green (uncharged hydrophilic), blue (positively charged hydrophilic), red (negatively charged hydrophilic), and yellow (uncharged hydrophobic). The first (upper) row of pictures shows skeletal models of segments of the polypeptide chain backbone; the unstructured and α-helix segments are depicted, respectively, as curves and arrow-ribands directed from the N to C end of the polypeptide chain. The first picture in the upper row shows a fragment of the wild-type RBD whose amino acid residue (in the ring) has undergone mutations shown in the right three pictures. The second, third, and fourth pictures in the upper row show the 3D aliment of the skeletal models of the wild-type strain and the point mutants. Discrepant segments (whose 3D coordinates are shifted) of the mutant polypeptide chain are colored according to the charge and hydrophilicity of the substituting (mutant) amino acid residue against the background of the gray polypeptide chain of the wild-type strain. The four pictures in the lower row represent the electric potential on the surface of RBD at pH 7.0. The potential is visualized by colorings according to its sign: positive (blue), negative (red), and neutral (white); the intensity of the colors corresponds to the kT/e scale (shown on the right) in the range ± 6 kT/e [J/C]; 1 kT/e = 26.7 mV at 37 °C.

