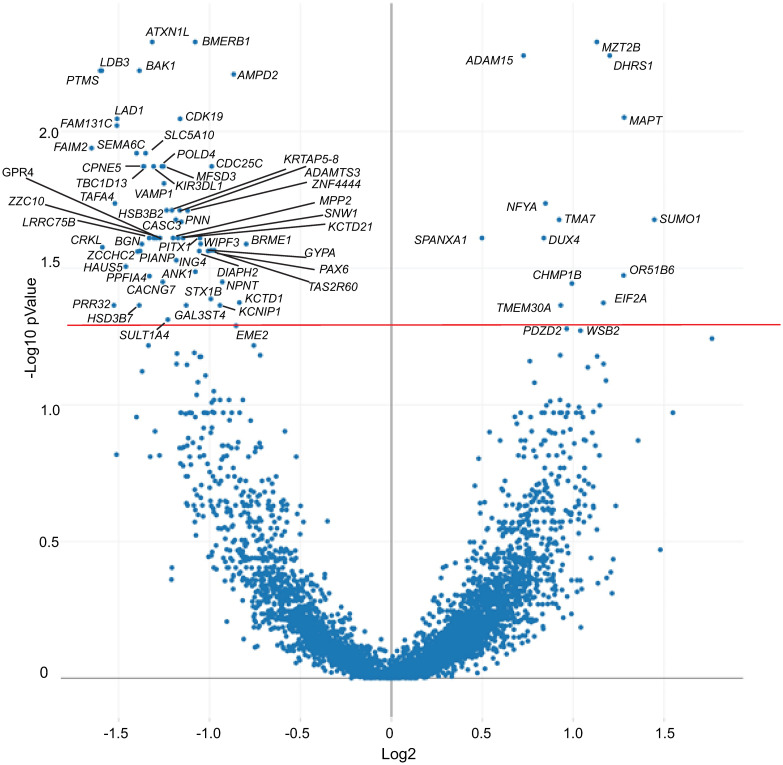
Fig 2. Volcano plot of differentially expressed genes.
Plot shows differential expression of genes in high and low outflow areas. Each dot represents a specific gene. The solid horizontal red line shows the cutoff for genes with an adjusted p value <0.05. Only statistically significant genes are labeled.

