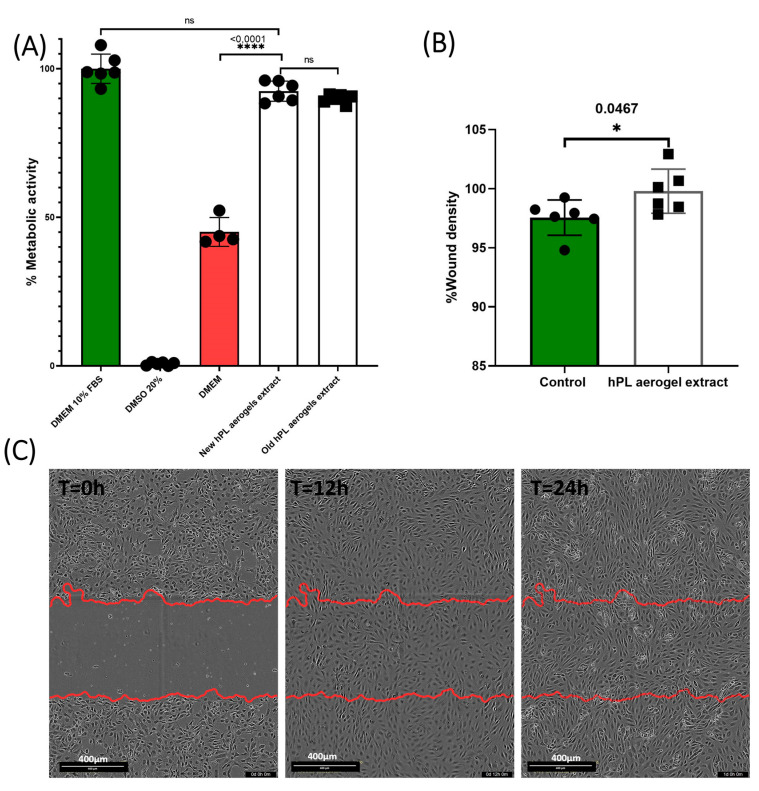
Figure 7.
This figure presents the results of the biological evaluation of products released by HPL aerogels. (A) The graph presents the metabolic activity of BALB 3T3 cells when exposed to the media conditioned by HPL aerogels, as measured by the MTT assay. Error bars represent standard deviation. (B) The graph displays the results of the scratch assay performed on HUVECs. It illustrates the migration capability of HUVECs when exposed to the released products from HPL aerogels. Error bars represent standard deviation. (C) The images show the scratch assay at T = 0 h, T = 12 h, and T = 24 h, providing a visual representation of cell migration in response to the released products. The statistical significance of the results was studied using ordinary one-way ANOVA and unpaired t-test with Welch’s correction for p < 0.05 (ns > 0.05, * p < 0.05, **** p < 0.0001). Error bars represent standard deviation (n = 6).

