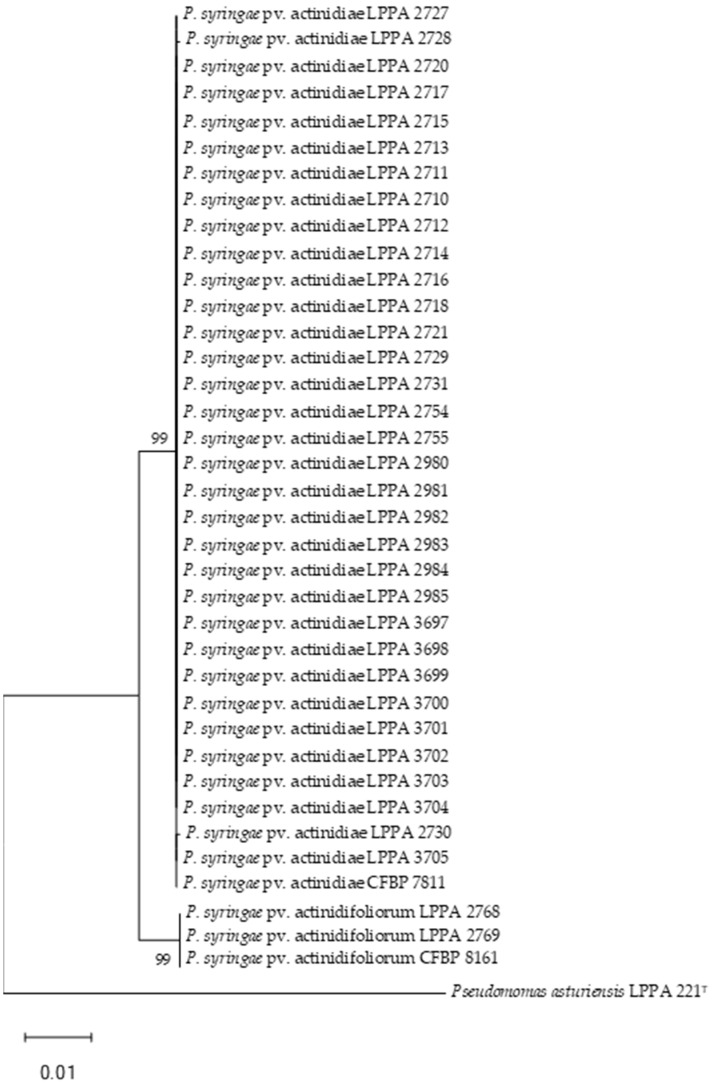
Figure 1.
Phylogenetic tree of Psa and Pfm strains based on concatenated partial sequences of the gltA, gyrB and rpoD genes by using the maximum likelihood method and Tamura–Nei model. Bootstrap values ≥ 50% (1000 replicates) are indicated at branch points. Bar scale, substitutions per site. This analysis involved 38 nucleotide sequences, with a total of 2263 positions. Analyses were conducted in MEGA11 [60]. P. asturiensis LPPA 221T was used as outgroup and P. syringae pv. actinidiae CFBP 7811 and P. syringae pv. actinidifoliorum CFBP 8161 as controls. Accession numbers of the sequences are shown in Supplementary Table S1.

