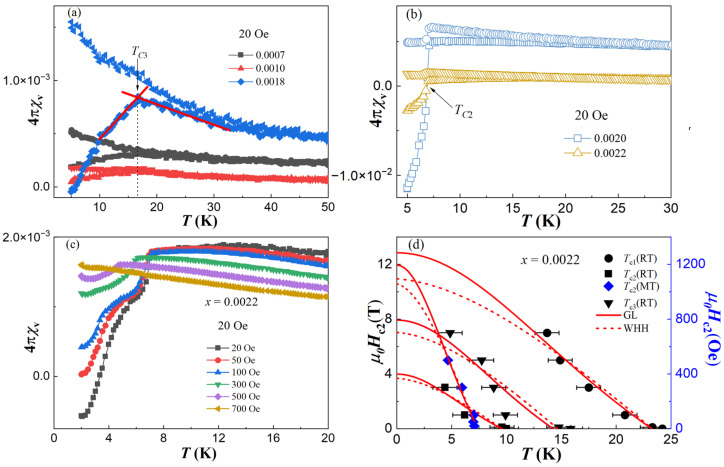
Figure 3.
The temperature dependence of magnetic susceptibility for (a) BaFe2(As1−xBix)2 (x = 0.0007, 0.0010 and 0.0018) with H = 20 Oe magnetic field, (b) x = 0.0020 and 0.0022 with H = 20 Oe magnetic field, and (c) x = 0.0022 under different magnetic fields. (d) The temperature dependence of µ0Hc2 for x = 0.0022 sample. The black points corresponding to the left coordinate axis are obtained from resistivity data in Figure 2c, and the blue points corresponding to the right coordinate axis are from the magnetization data in (c). The red solid lines are the fitting lines according to GL function, and the red dash lines are according to WHH function.

