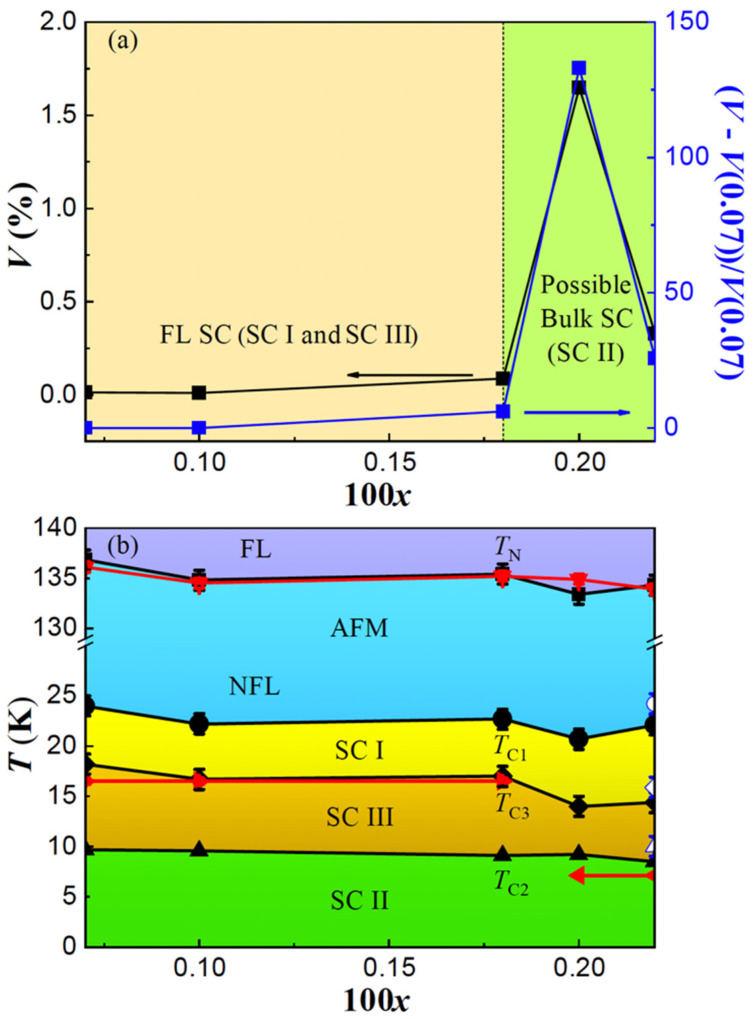
Figure 5.
(a) The concentration 100x dependence of superconducting volume (left axis) and the relative variation ratio (V − V(x = 0.0007))/V(x = 0.0007) (right axis). (b) The phase diagram of BaFe2(As1−xBix)2 as a function of concentration 100x. The solid black (empty blue) points are derived from resistivity measured with 10 mA (1 mA) current. The solid red points are derived from magnetic susceptibility.

