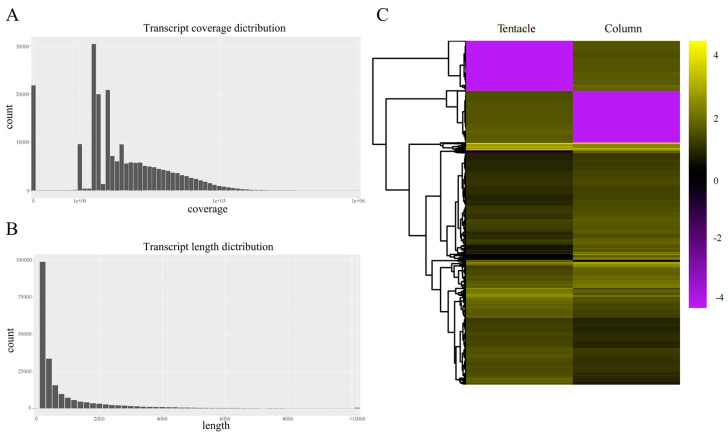
Figure 1.
Summary of the H. magnifica transcriptome assembly. (A) The coverage of assembled transcripts after mapping of raw sequences back to the assembly; (B) the transcript length distribution; (C) a heatmap of differentially expressed genes (DEGs; colored for RPKM values) for the column and tentacles tissues in H. magnifica.

