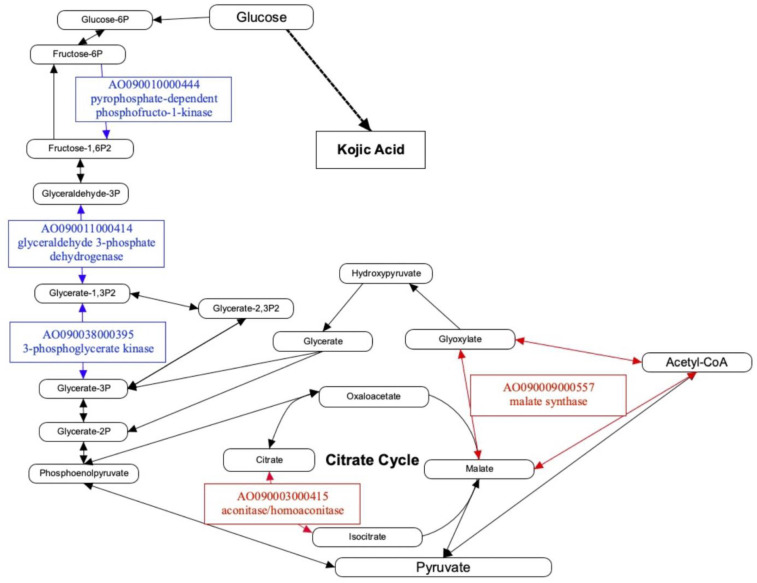
Figure 4.
Mapping of differentially expressed genes (DEGs) associated with kojR expression to A. oryzae carbon metabolic pathway. Red, DEG whose expression levels in A. oryzae RIB40 are higher than that in ΔkojR strain; blue, DEG with lower expression levels in A. oryzae RIB40 than that in ΔkojR strain. A metabolic map was created using the PathVisio software (Ver. 3.3.0) [25] based on the carbon metabolism (aor01200) and glycolysis/gluconeogenesis (aor00010) of A. oryzae in KEGG [24].

