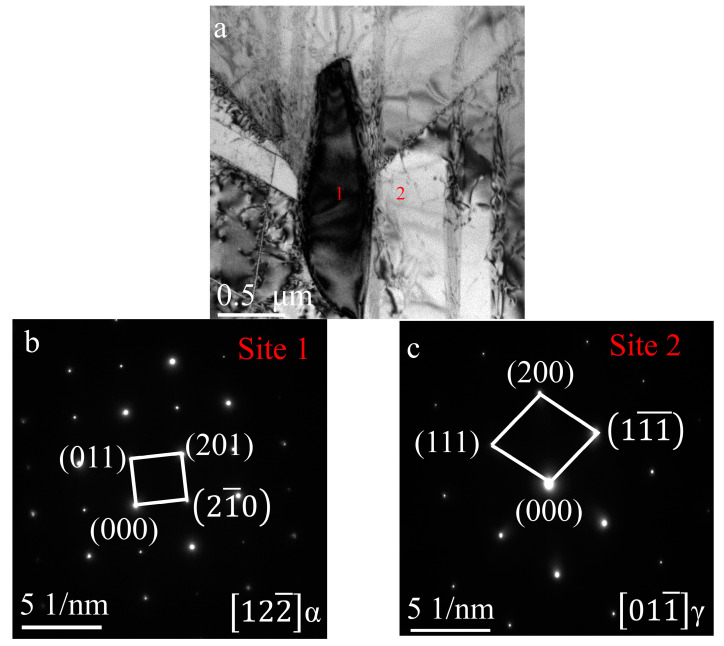
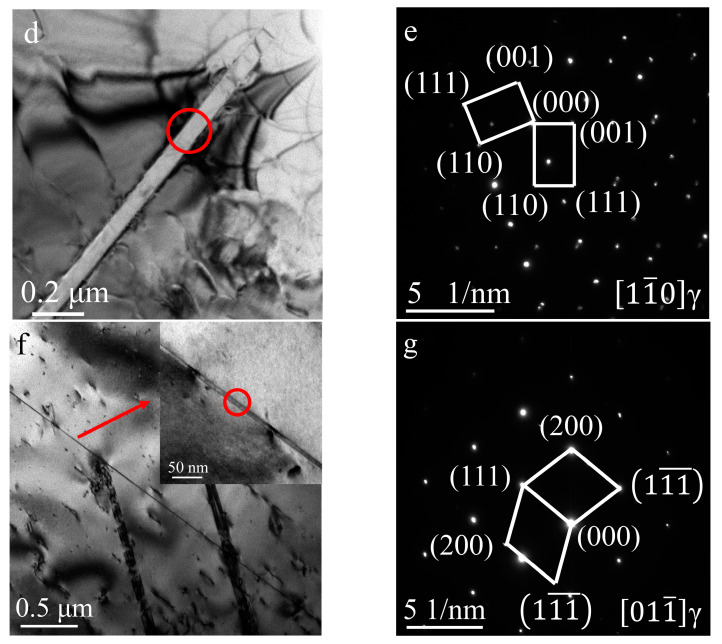
Figure 11.
TEM images of the P–HIP Ti–48Al–3Nb–1.5Ta alloy exposed at 800 °C for 1000 h: (a) BF image showing two phases; (b) SAED of site 1 in Figure 11a; (c) SAED of site 2 in Figure 11a; (d) BF image of γ-phase twins; (e) SAED of circled area in Figure 11d; (f) BF image of nanotwins; (g) SAED of circled area in Figure 11f.


