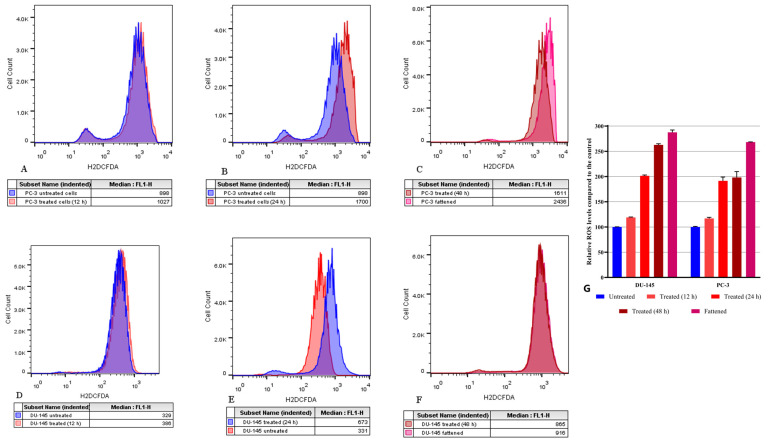
Figure 8.
Intracellular reactive oxygen species (ROS) determination with flow cytometry using the H2DCFDA assay. Cells were incubated with high doses of Cunninghamella elegans FALS (54 μg/mL) and then trypsinized. The histograms represent different time points where ROS were measured in both cell lines. (A) Untreated PC-3 cells and cells treated for 12 h; (B) PC-3 cells treated for 24 h; and (C) PC-3 cells treated for 48 h compared to fattened PC-3 cells. (D) Untreated DU-145 cells and cells treated for 12 h; (E) DU-145 cells treated for 24 h; and (F) DU-145 cells treated for 48 h compared to fattened DU-145 cells. (G) Following analysis with Prism 8, the results are presented as relative ROS accumulation compared to the control group. All experiments were performed in triplicate, and the results were normalized using the untreated population of each cell line. The values represent averages ± SEM. Statistical analysis with a one-way ANOVA test revealed significant changes among all groups (p < 0.0001).

