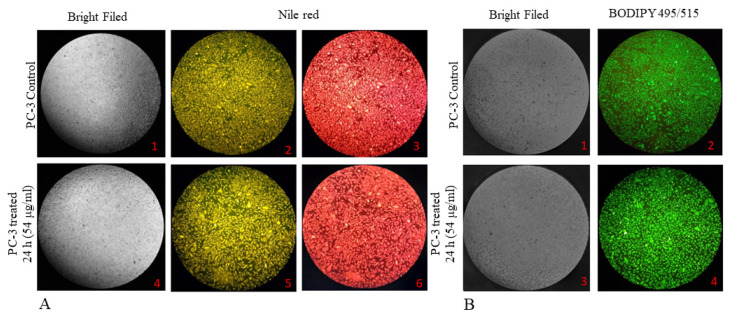
Figure A6.
Lipid accumulation fluorescent microscope. Following incubation with 54 μg/mL FALS for 24 h, cells were grown on glass coverslips and stained with (A) Nile red and (B) BODIPY™ 505/515. All photographs were taken at ×200 magnification. (A1) Bright-field image of untreated PC-3 cells; (A2) yellow fluorescence emitted by Nile red, indicating neutral lipid and sterol content of untreated PC-3 cells; (A3) red fluorescence by Nile red, indicating phospholipid content of untreated PC-3 cells; (A4) bright-field image of treated PC-3 cells; (A5) yellow fluorescence emitted by Nile red, indicating neutral lipid and sterol content of treated PC-3 cells, showing increased presence; (A6) red fluorescence by Nile red, indicating phospholipid content of treated PC-3 cells, which is similar to that of untreated cells. (B1) Bright-field image of untreated PC-3 cells; (B2) fluorescence emitted by BODIPY™ 505/515 after staining of untreated cells; (B3) bright-field image of treated PC-3 cells; (B4) fluorescence emitted by BODIPY™ 505/515 after staining of treated cells. The increased intensity of the emitted fluorescence is typical of lipid accumulation.

