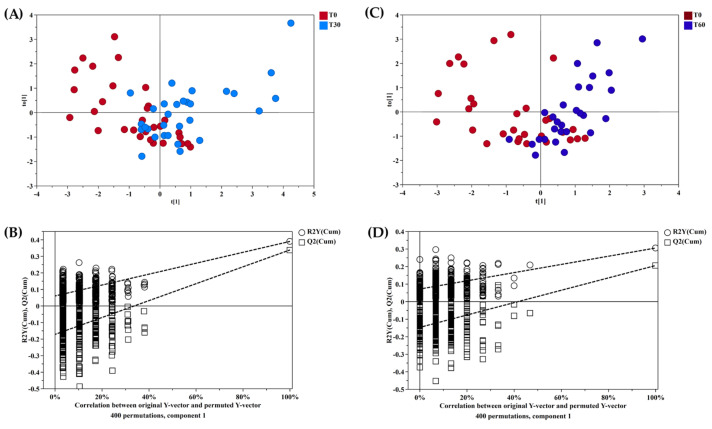
Figure 3.
(A,C) OPLS-DA score plots of 1H-NMR spectra of urine samples. Red dots: T0; light blue dots: T30; blue dots: T60. (B,D) Permutation test. The horizontal axis shows the correlation between the permuted and actual data, while the vertical axis displays the cumulative values of R2 and Q2. The intercept gives an estimate of the overfitting phenomenon.

