
Fig. 5. HDM and IL-31 activate partially-overlapping subsets of TRPV1+ sensory afferents.
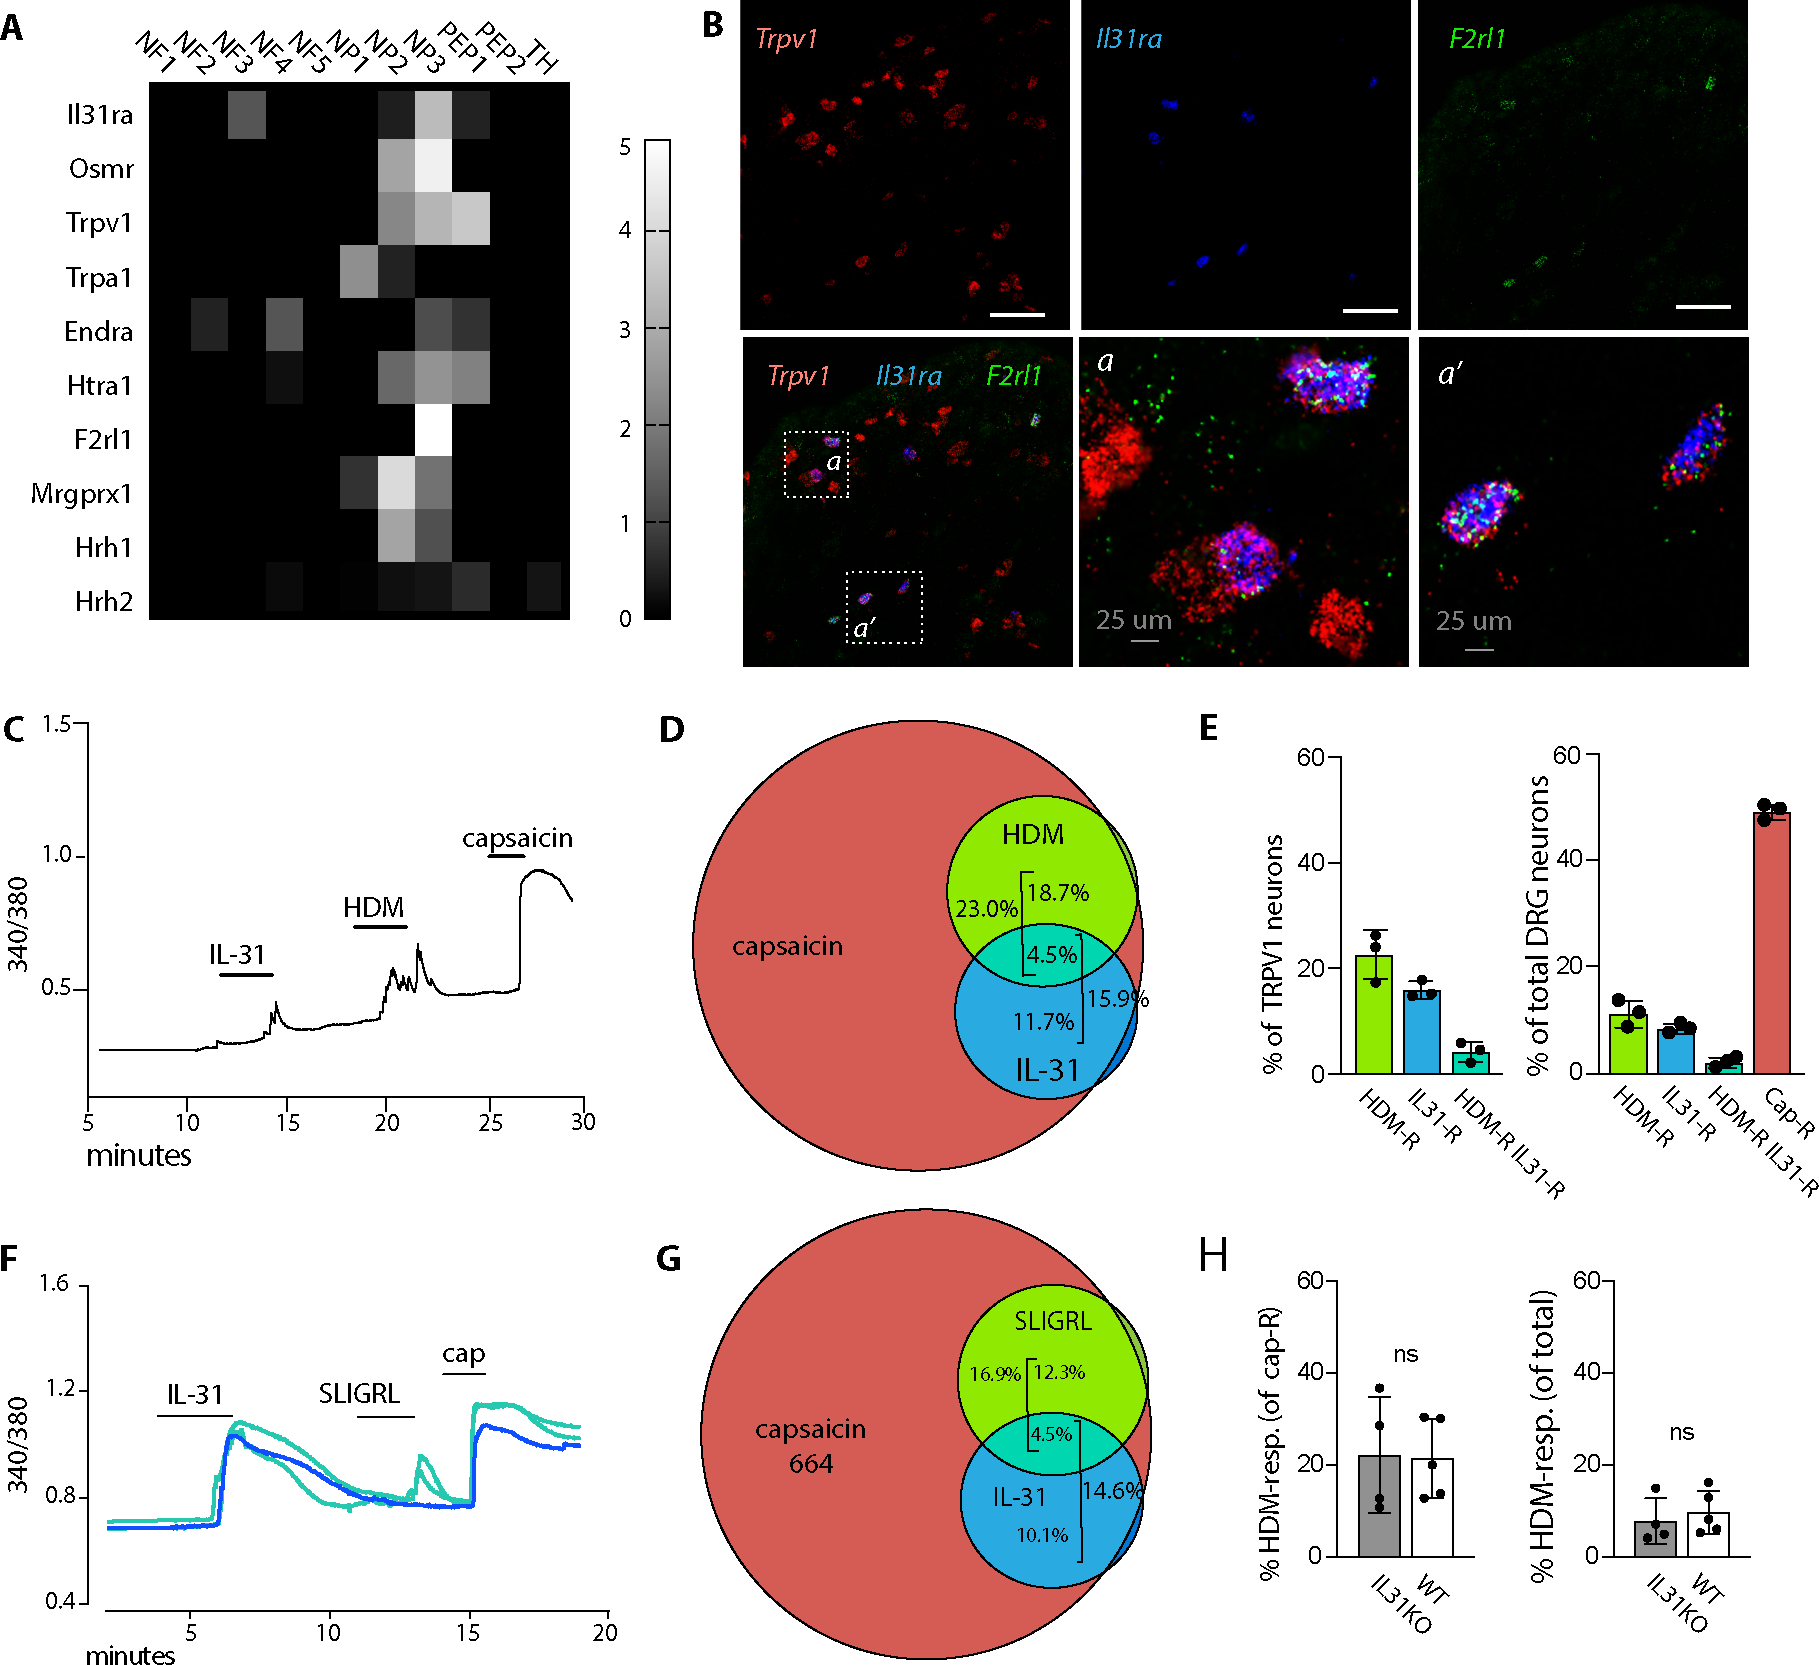
(A) Heat map depicts differential gene expression of select pruritogen receptors in dorsal root ganglia afferent neuron subsets, extracted from Usoskin et al(30). Scale indicates the maximum likelihood estimate of differential expression (log2fold change) in each DRG neuron subset calculated relative to all other DRG subsets, as described in Usoskin et al(30).
(B) Representative images of Trpv1, Il31ra, and F2rl1 in situ hybridization in trigeminal ganglia (TG) tissue sections from untreated animals.
(C) Representative 340/380 trace from calcium imaging of a Fura-2 loaded lumbar dorsal root ganglion (DRG) neuron double-responsive to IL-31 and HDM. Capsaicin response indicates that the neuron is TRPV1+.
(D) Venn diagram indicating the proportion of WT DRG neurons responding to each of the indicated ligands (capsaicin, HDM, and recombinant IL-31). Capsaicin response marks TRPV1+ neurons.
(E) Quantification of DRG neurons responsive to the indicated ligands. Each dot represents the average % responding cells from at least 4 coverslips from a single animal. Left panel TRPV1+ (capsaicin-responsive), right side all neurons.
(F) Representative 340/380 traces from calcium imaging of Fura-2 loaded lumbar DRG neurons that were monoresponsive to IL-31 (blue) or double-responsive to IL-31 and SLIGRL (turquoise). Capsaicin (cap) responses indicate TRPV1+ neurons.
(G) Venn diagram indicating the proportion of WT DRG neurons responding to each of the indicated ligands (capsaicin, SLIGR, and IL-31).
(H) Quantification of % DRG neurons responsive to HDM in WT (black bars) or IL31KO (open bars). Each dot represents the average % responding cells from at least 4 coverslips from a single animal.
Numbers indicate total responding neurons recorded from at least 4 mice per genotype (D, E, G); and 5 each of WT mice and IL31KO mice (H). Error bars displayed as mean +/−SD.