
Figure 6. IL-31-induced neuronal CGRP release reduces T cell proliferation and IL-13 production.
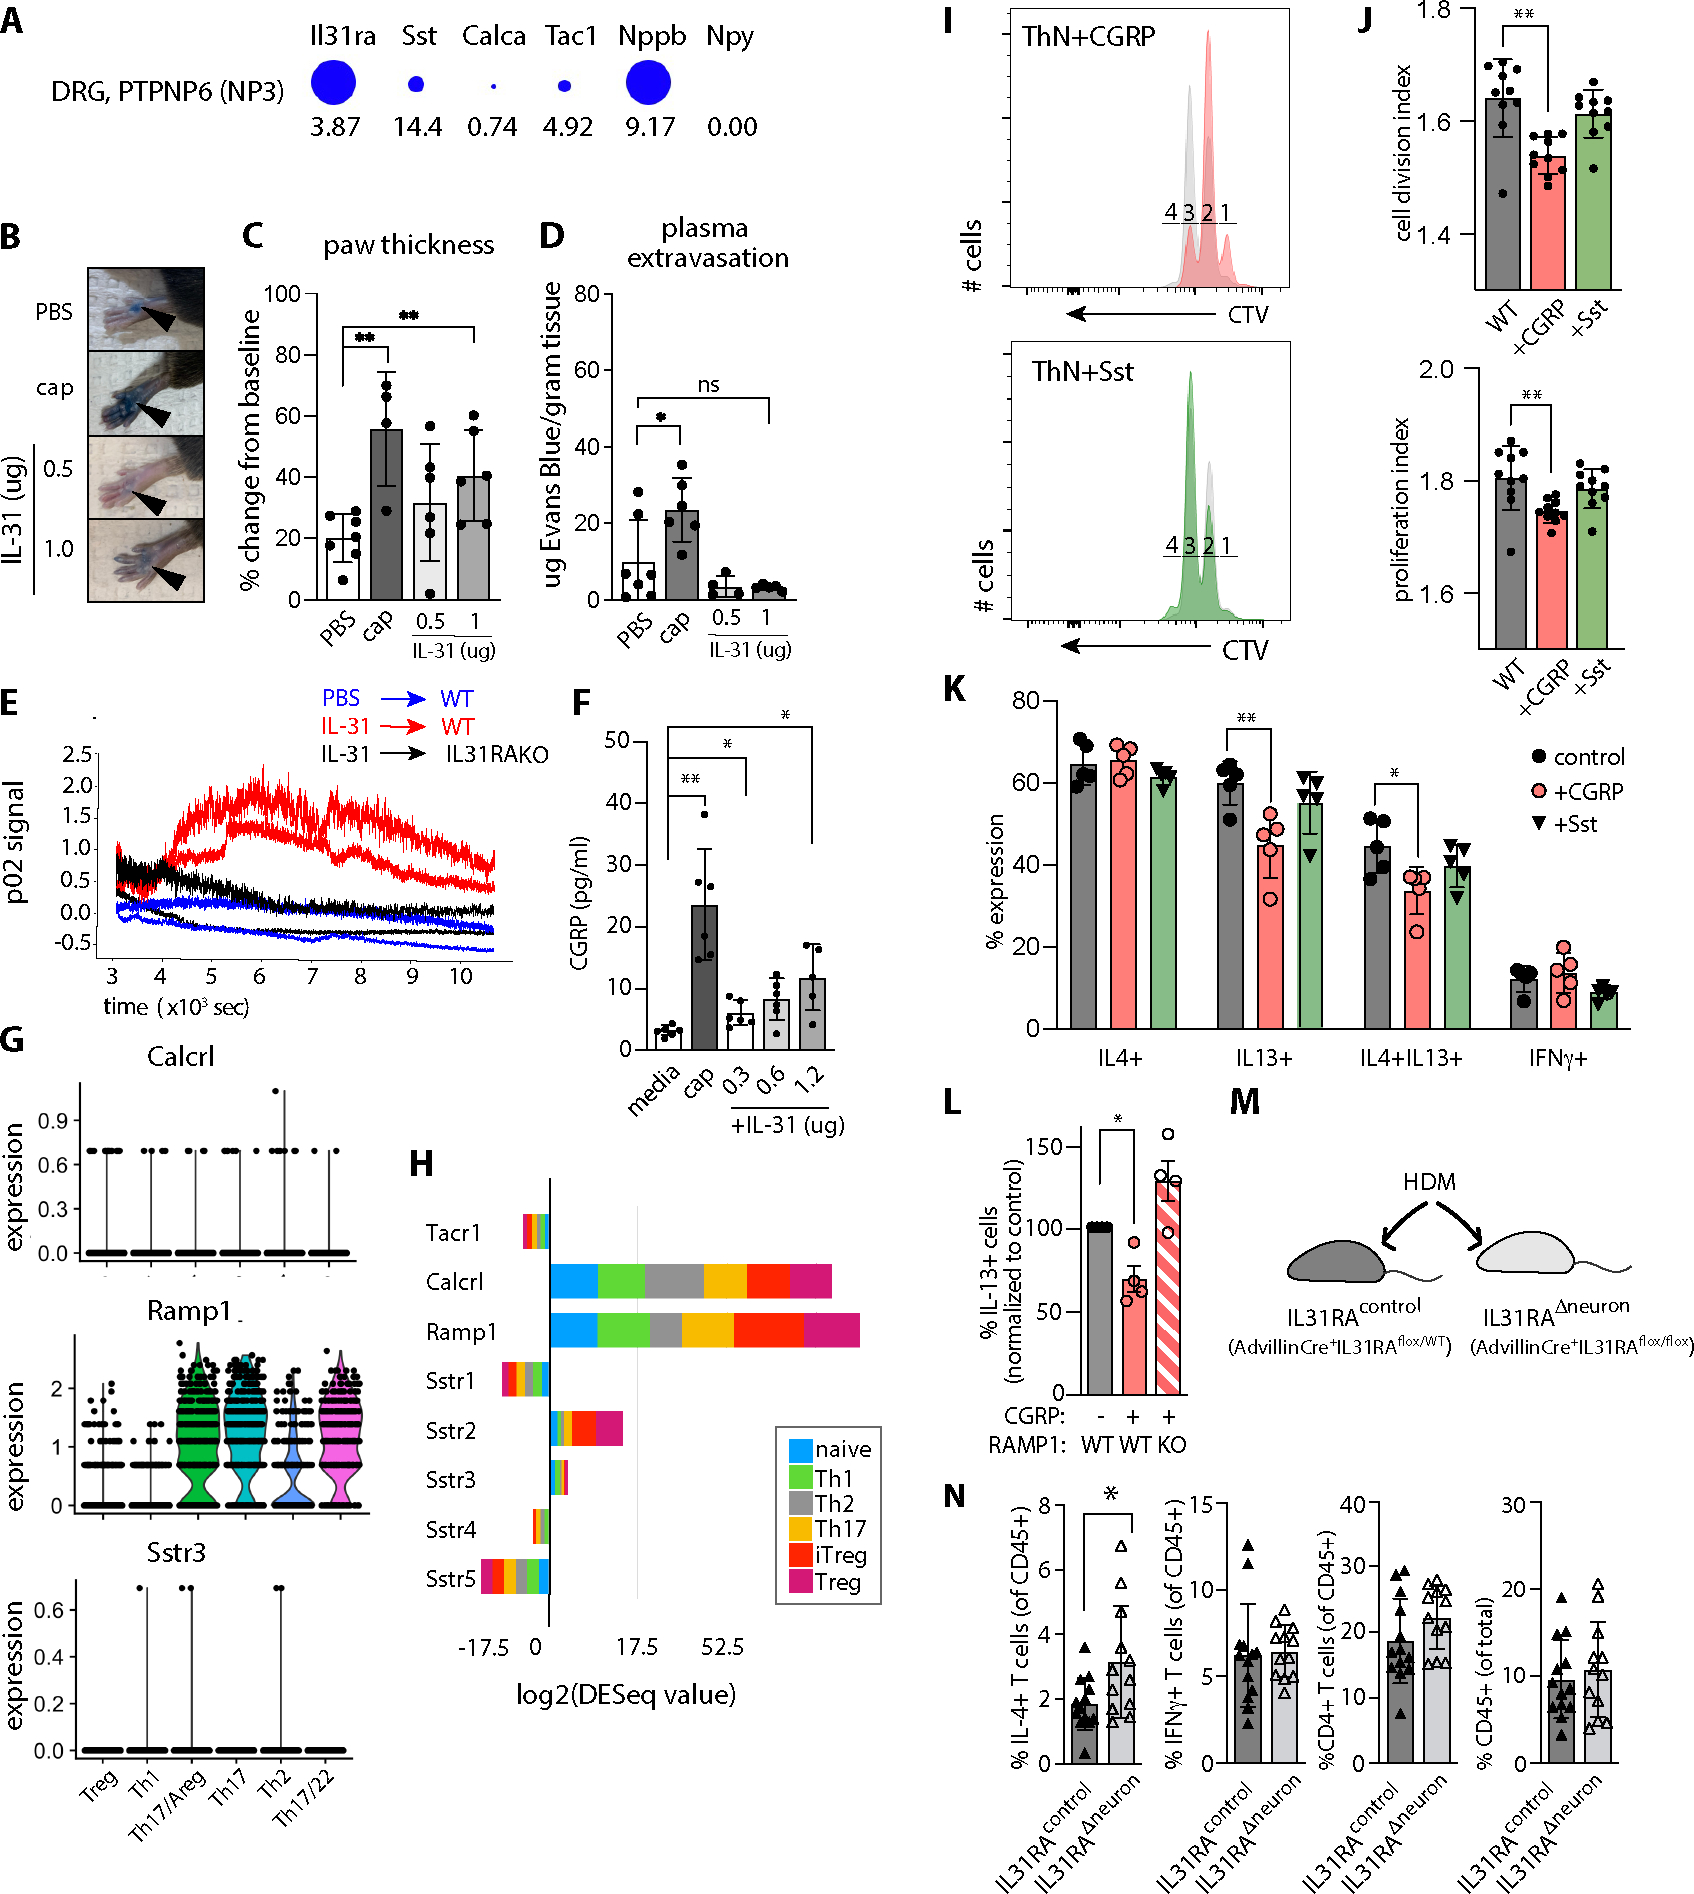
A) Il31ra and neuropeptide expression in NP3 DRG neurons. Diameter indicates proportion of cells expressing the gene, numbers indicate expression relative to other sequenced cells in the dataset. Data extracted from (30, 62) using mousebrain.org visualization tools.
B) Mouse hindpaw images after retro-orbital Evans Blue injection and plantar paw injection with PBS, capsaicin (cap) or recombinant mouse(rm) IL-31. Note: Focal blue injection site staining of stratum corneum is expected.
C) Percent change in paw thickness immediately prior to and 15 minutes after PBS, capsaicin, or rmIL-31 intradermal paw injection. Mixed-effects model testing p=0.0282 (*), pairwise post-test probabilities n.s.
D) Quantification of Evans Blue dye in paw tissue harvested 15 minutes after PBS, cap, or rmIL-31 intradermal injection. Mixed-effects model testing p=0.0123 (*), post-test probabilities nonsignificant.
E) Quantification of local blood flow measured by Oxyflow probe applied to mouse paw, immediately after injection of IL-31 or PBS.
F) CGRP concentration in TRG neuron culture media after 30 minute incubation with capsaicin or rmIL-31. Representative of 3 experiments. Welch’s one-way ANOVA 0.0006; post-test probabilities as indicated.
G) Neuropeptide receptor expression in HDM-treated skin CD4+ T cell subsets. Tacr1 not detected.
H) Neuropeptide receptor expression in in vitro-polarized CD4+ T cell subsets, data extracted from ThExpress(37).
I) CellTrace Violet (CTV) dilution histograms as a measure of mouse lymph node CD4+ T cell proliferation in culture. Colored histograms depict T cells cultured in the presence of neuropeptides as indicated (CGRP orange, Sst green), overlaid on paired controls (grey). Numbers indicate cell division gates where 1 = undivided cells.
J) Cell division index (upper panel) and proliferation index (lower panel) of CTV-labeled CD4+ T cells cultured +/−neuropeptides as indicated. Representative of 3 experiments. Wilcoxon matched-pairs signed rank test for division index p=0.0003, proliferation index p=0.0037).
K) Effector cytokine expression in in vitro-differentiated CD4+ T cells cultured +/− neuropeptides: CGRP (orange bars), somatostatin (green bars), or no neuropeptide (control, grey bars). IL-4+ (left panel, n.s.), IL-13+ (left center; one-way Welch’s ANOVA p=0.0019, pairwise post-test significance as indicated), IL-4+IL-13+ (right center; one-way Welch’s ANOVA p=0.0042, pairwise post-test significance as indicated), or IFNγ+ (right, n.s.).
L) Percent IL-13+ CD4+ T cells in in vitro-differentiated WT or RAMP1KO T cellscultured in the presence or absence of CGRP. Brown-Forsythe one-sided ANOVA, p=0.0108 (*).
M) Advillin-Cre+.Il31raflox/flox (Il31raΔneuron) mice exhibit conditional ablation of Il31ra in Advillin+ cells (sensory and sympathetic neurons). Advillin-Cre+.Il31raflox/WT littermates were used as controls for HDM dermatitis (N).
N) Flow cytometry-based quantification of skin cell populations from HDM-treated Advillin-Cre+IL31raflox/WT (=IL31raflox/WT) and Advillin+IL31raflox/flox (=IL31Δneuron) mouse dorsal skin: IFN-γ+ CD4+ T cells, IL-13+ CD4+ T cells, total CD4+ T cells, CD45+ cells. Representative of 2 experiments, n≥5/group for HDM-treated animals. Significance determined by unpaired 2-tailed student’s t-test. See Fig. S3 for gating strategy.
Data points reflect biological replicates. Error bars displayed as mean +/−SD. For all experiments, ns = p>0.05, * = p<0.05, ** = p<0.01, *** = p<0.001, **** = p<0.0001.