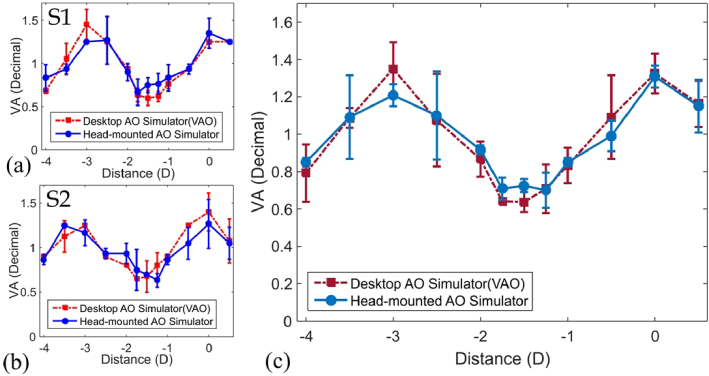
Fig. 9.
Subjective evaluation of defocus curves when simulating a diffractive bifocal lens on the developed head-mounted device and commercial desktop AO simulator. (a) shows the comparison of defocus curves for the young subject with paralyzed accommodation, (b) a comparison of defocus curves for the presbyopia patient, and (c) shows the average defocus curves for both subjects. The error bars indicate the standard deviation.

