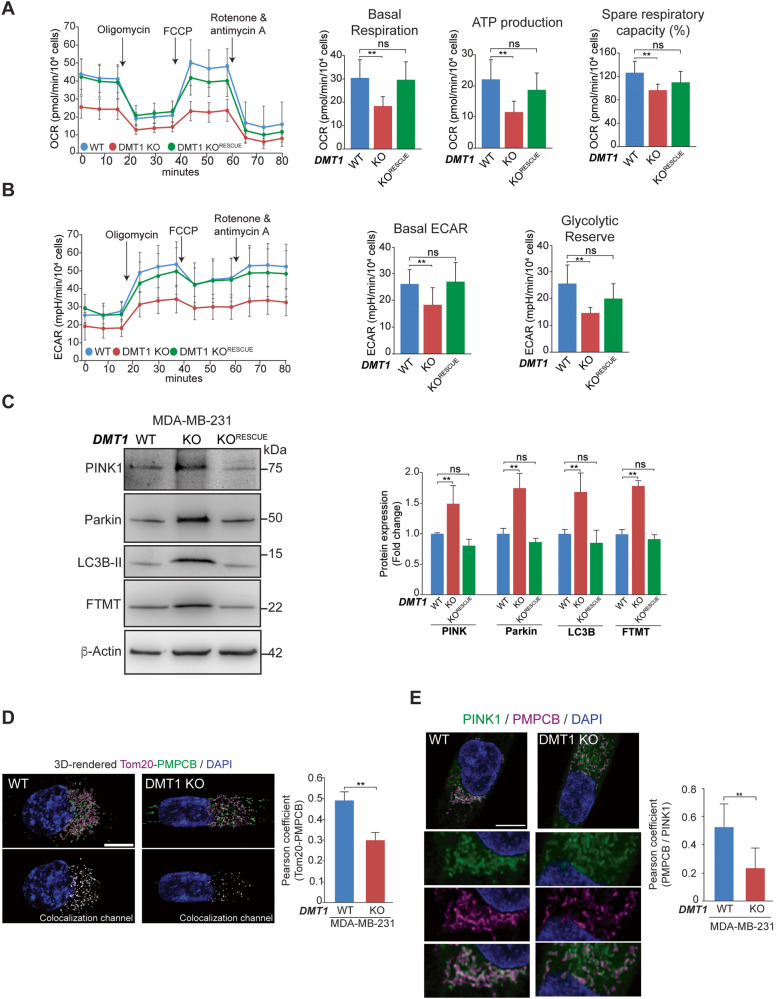
Fig. 4. DMT1 silencing impairs oxidative/glycolytic mitochondrial metabolism and activates PINK1/Parkin-dependent mitophagy in MDA-MB-231 cells.
A, B Oxygen consumption rate (OCR) and extracellular acidification rate (ECAR) in response to sequential treatment with oligomycin, FCCP, and Rotenone & Antimycin A of MDA-MB-231 WT, DMT1 KO, and DMT1 KORESCUE cells are shown. Data were normalized for the number of cells (40,000 cells/well) that were stained using Hoechst at the end of the assay (n = 3, 6–10 replicates per condition). Basal respiration, ATP production, and spare respiratory capacity were calculated using OCR data. Basal ECAR and glycolytic reserve were calculated using ECAR data. Bar charts: one-way ANOVA with Bonferroni post-hoc test. *p < 0.05; **p < 0.01. ns: non-significant. Scale bar = 100 μm. C Representative immunoblots (left) and normalized densitometry quantification graph (right) of PINK1, Parkin, LC3B-II, and mitochondrial ferritin (FTMT) in MDA-MB-231 WT, DMT1 KO, and DMT1 KORESCUE cells. β-Actin was used as a loading control. Bar charts: one-way ANOVA with Bonferroni post-hoc test (n = 3). *p < 0.05; **p < 0.01. ns: non-significant. D Immunofluorescence of Tom20 and PMPCB shows a decrease in colocalization between both proteins upon DMT1 silencing in MDA-MB-231. Pearson colocalization coefficient was analyzed using IMARIS 9.6 software in 25 cells per condition. Unpaired t-test. **p < 0.01. Scale bar = 10 μm. E Immunofluorescence of PINK1 and PMPCB shows a decrease in colocalization between both proteins, and mitochondrial fragmentation upon DMT1 silencing in MDA-MB-231. Pearson colocalization coefficient was analyzed using IMARIS 9.6 software in 25 cells per condition. Unpaired t-test. **p < 0.01. Scale bar = 10 μm.

