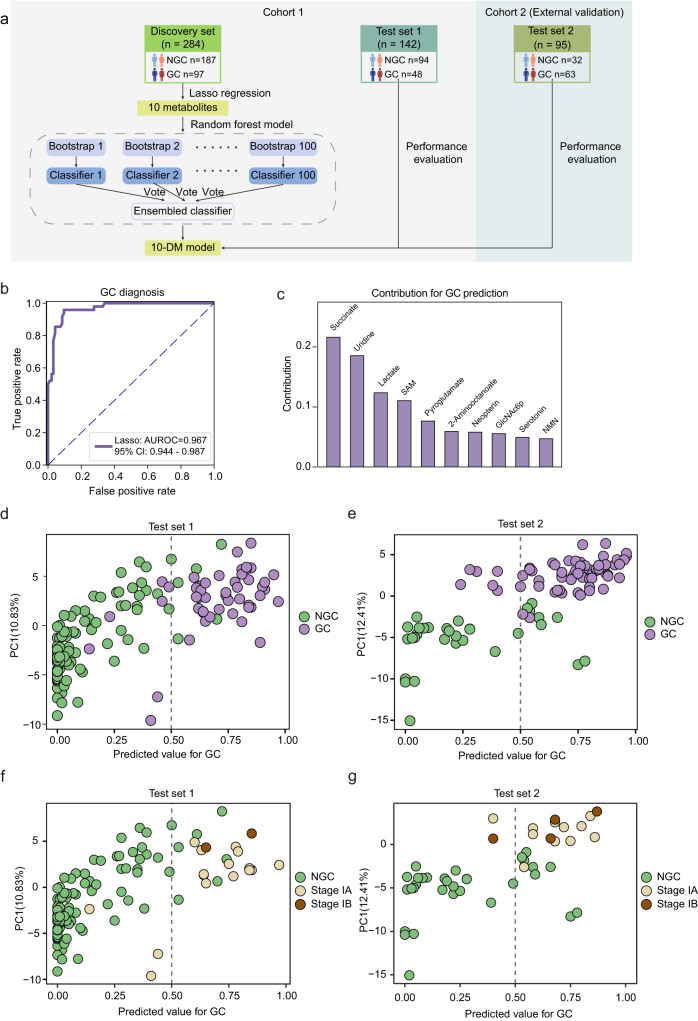
Fig. 3. Machine learning-derived prediction model based on plasma metabolome for GC diagnosis.
a Design of the modeling workflow. LASSO regression and random forest algorithm were adopted for feature selection and model training. The 10-DM model was validated in a test set and an external test set. The illustration was created with a full license on BioRender.com. b The Receiver operating characteristic (ROC) curve for the diagnosis of GC patients in the test set 1. A 95% confidence interval was calculated based on the mean and covariance of one thousand random sampling tests. c Contribution of the ten metabolites to the 10-DM model. d–g, The prediction performance of the 10-DM model for distinguishing GC (colored in purple) from NGC (colored in green) in the test set 1 (d) and the test set 2 (e) and for distinguishing stage I GC patients (stage IA colored in yellow and stage IB colored in brown) from NGC in the test set 1 (f) and the test set 2 (g). The dotted line represented the cutoff value of 0.50 used to separate the predicted NGC (on the left side) from GC (on the right side). Source data are provided as a Source Data file.

