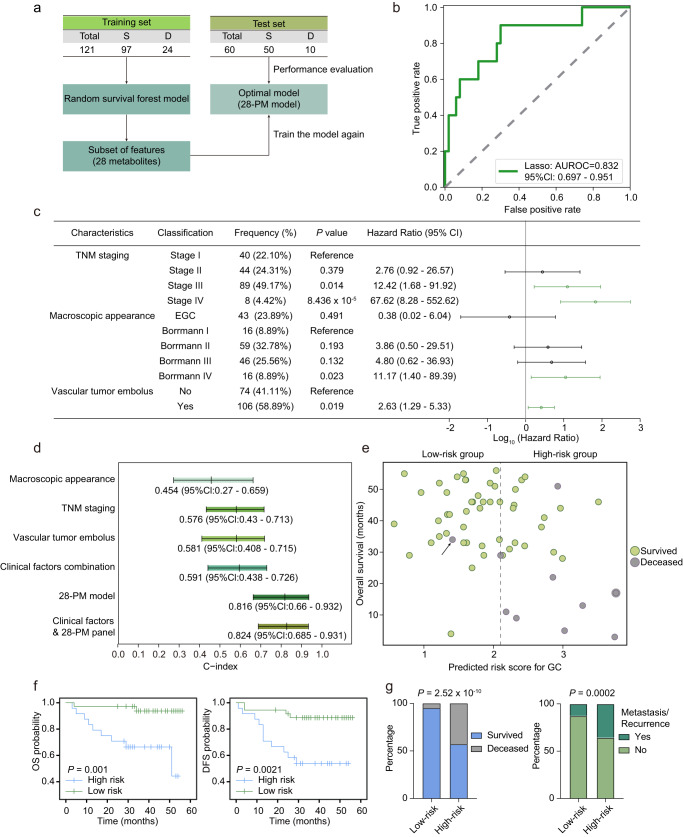
Fig. 4. The prognostic model outperformed clinical parameters in predicting outcomes of GC patients.
a Schematic outline of the prognostic model design. S survived, D deceased. b ROC curve analysis of the test set. 95% CI was calculated based on the mean and covariance of one thousand random sampling tests. c Forest plot of clinical parameters with significant prognostic relevance identified by univariate Cox regression analysis. Parameters with a P < 0.05 were considered statistically significant and represented by green lines. The center dots and lines represent HR and 95% Cl scaled by log 10. EGC, early gastric cancer. P-values of TNM staging, macroscopic appearance, and vascular tumor embolus were calculated based on data from n = 181, 180, and 180 independent samples respectively. d C-index values comparison of the macroscopic appearance, TNM staging, vascular tumor embolus, and the 28-PM model in the test set (n = 60). C-index and the 95% Cl were presented under the relative colored bars. e Prognostic prediction of the test set patients (n = 60) using the 28-PM model. The dotted line drawn at the cutoff value of 2.1 divided the patients into high- and low-risk groups. Green circles and gray circles represent survived and deceased in the test set. The arrow pointed out the deceased patient dying of a heart attack. f Kaplan–Meier curves showing the overall survival (OS) and disease-free survival (DFS) of test set GC patients (n = 60) stratified by prognostic risk scores (cutoff = 2.1). P-values were calculated with a two-sided log-rank test. g The high-risk group presented a higher proportion of deceased and relapse/metastasis. A two-sided Fisher’s exact test was used to calculate the P-value. Source data are provided as a Source Data file.

