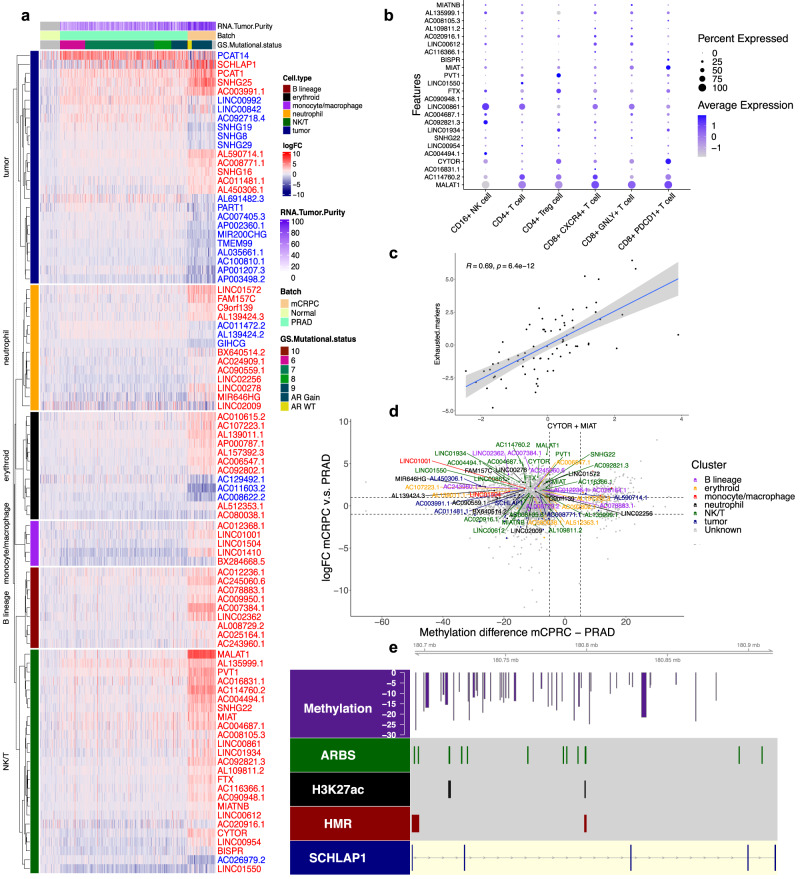
Fig. 3. Single-cell analysis informs bulk expression analysis of lncRNAs associated with prostate cancer progression.
a Heatmap of differentially expressed lncRNAs in bulk RNA-seq for n = 333 primary prostate and n = 74 mCRPC samples with significantly upregulated genes in red and downregulated genes in blue25. Cell types associated with each gene are shown on the left side. Samples are ordered column-wise with normal adjacent prostate, primary prostate cancer, and mCRPC from left to right. Samples in primary prostate cancers are ordered by increasing Gleason Score and for mCRPC by the genomic status of the AR region. b Dot plot of differentially expressed NK/T-lncRNAs and T-cell subtypes in scRNA-seq data. c Correlation between expression of MIAT and CYTOR with exhausted T-cell markers from in ref. 16 in bulk mCRPC RNA-seq data16. d Methylation of differentially methylated regions (x axis) nearby differentially expressed (y axis) lncRNAs in mCRPC vs. primary prostate cancer14. e Gene plot of SCHLAP1 overlaid with HMRs (red), H3K27ac (black), AR binding sites (green), and differentially methylated regions (DMRs) (purple) between mCRPC vs. primary prostate cancer14,26.

