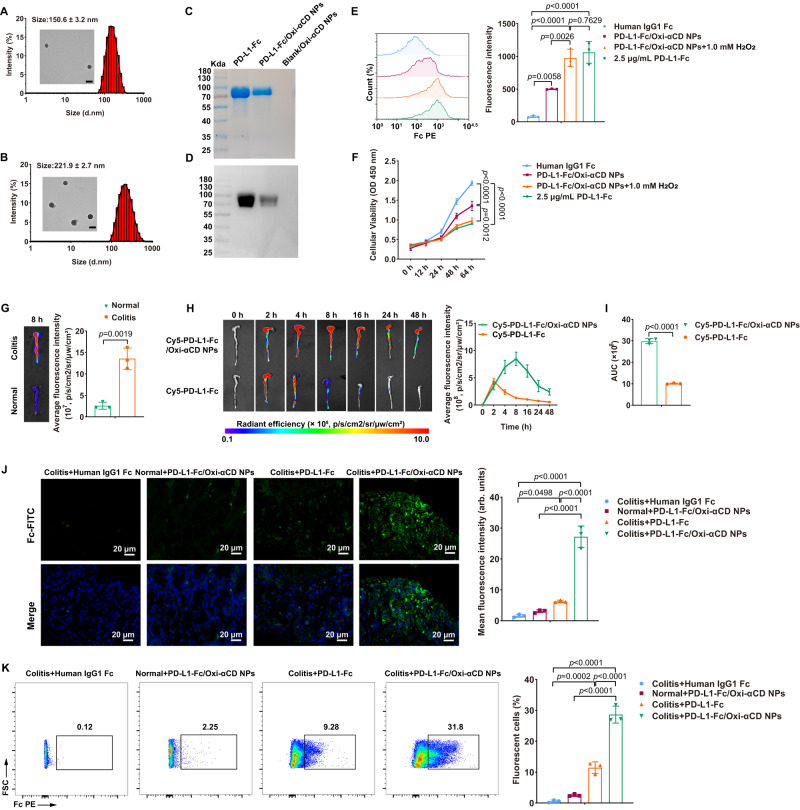
Fig. 2. Physiochemical characterization of the PD-L1-Fc/Oxi-αCD nanoparticles and selective accumulation of Cy5-labeled PD-L1-Fc/Oxi-αCD nanoparticles in the colons of DSS-induced mice.
A, B Transmission electron microscopy (TEM) images and size distribution profile of PD-L1-Fc/Oxi-αCD nanoparticles (n = 3 independent experiments). Loading of the PD-L1-Fc protein on Blank/Oxi-αCD nanoparticles was confirmed by SDS‒PAGE (C) and western blotting (D). E Flow cytometry analysis of the hydrolyzed and unhydrolyzed PD-L1-Fc/Oxi-αCD nanoparticles binding capability to spleen lymphocytes (n = 3 biologically independent samples, p = 5.75459 × 10⁻³, 3.19572 × 10⁻⁵, 1.61351 × 10⁻⁵, 2.64841 × 10⁻³ and 7.62943 × 10⁻¹). The fluorescence intensity of PE revealed the bioactivity of PD-L1-Fc after chemical conjugation to the nanoparticles and after release from the nanoparticles. Human IgG1 Fc was used as a negative control. F Cell Counting Kit-8 (CCK-8) analysis of the cellular viability of anti-CD3-activated spleen lymphocytes treated with hydrolyzed or unhydrolyzed PD-L1-Fc/Oxi-αCD nanoparticles (n = 3 biologically independent samples, p = 5.91104 × 10⁻⁵, 1.36050 × 10⁻⁶ and 1.23415 × 10⁻³). G Ex vivo images (left) and quantitative analysis (right) illustrating the distribution of Cy5-PD-L1-Fc/Oxi-αCD nanoparticles in the colons of mice with or without DSS-induced acute colitis at 8 h after intraperitoneal injection (n = 3 mice, p = 1.87007 × 10⁻³). H Ex vivo images (left) and quantitative data (right) of the colons from colitis mice treated with free Cy5-PD-L1-Fc or Cy5-PD-L1-Fc/Oxi-αCD nanoparticles. I The area under the fluorescence intensity-time curve (AUC) (right) of Cy5 fluorescence in the colons after treatment with Cy5-PD-L1-Fc or Cy5-PD-L1-Fc/Oxi-αCD nanoparticles (n = 3 mice, p = 9.37820 × 10⁻⁶). J CLSM images (left) and quantitative data (right) of frozen colonic sections from mice treated with different formulations for approximately 8 h (n = 3 mice, p = 4.98164 × 10⁻², 5.33800 × 10⁻⁷, 8.73300 × 10⁻⁷ and 2.65730 × 10⁻⁶). Blue channel, nucleus; green channel, PD-L1-Fc. K Flow cytometry analysis of the distribution of PD-L1-Fc delivered by different formulations in colonic lamina propria cells from normal or colitis mice (n = 3 mice, p = 2.21326 × 10⁻⁴, 1.35800 × 10⁻⁷, 2.65200 × 10⁻⁷ and 7.46180 × 10⁻⁶). Data are presented as mean ± SD. P values derived from one-way ANOVA analysis followed by Tukey’s multiple comparisons test (E, F, J, K) or two-sided Student’s t test (G, I). Source data are provided as a Source Data file. NPs nanoparticles.

