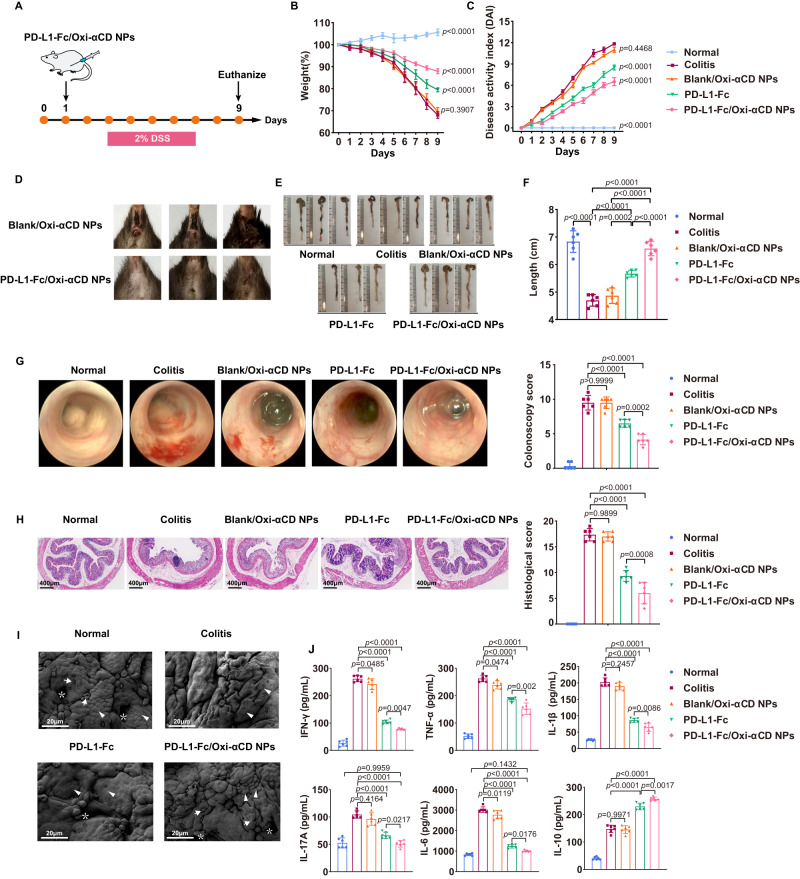
Fig. 3. Therapeutic effect of PD-L1-Fc versus PD-L1-Fc/Oxi-αCD nanoparticles on acute DSS-induced colitis.
A Schematic diagram of colitis model preparation and treatment protocol. Changes in body weight (B) and DAI scores (C) of mice in each group during 9 days of treatment. Comparisons were performed between the colitis group and other groups. In panel (B), n = 6 mice, p = 3.30000 × 10⁻¹⁴, 3.90705 × 10⁻¹, 2.92800 × 10⁻¹² and 3.30000 × 10⁻¹⁴. In (C), n = 6 mice, p = 3.30000 × 10⁻¹⁴, 4.46794 × 10⁻¹, 3.41556 × 10⁻⁶ and 4.92972 × 10⁻¹⁰. D PD-L1-Fc/Oxi-αCD nanoparticles effectively alleviated symptoms of rectal bleeding in mice with enteritis compared with treatment with Blank/Oxi-αCD nanoparticles. Representative digital photos (E) and quantified lengths (F) of colonic tissues isolated from mice after treatment (n = 6 mice, p = 3.65600 × 10⁻¹², 1.51912 × 10⁻⁵, 5.55390 × 10⁻¹¹, 2.25584 × 10⁻⁴, 3.94186 × 10⁻¹⁰ and 3.38584 × 10⁻⁵). G Representative mini-endoscopic images of colons from mice in the different treatment groups (n = 6 mice, p = 3.87125 × 10⁻⁶, 9.99900 × 10⁻¹, 6.26880 × 10⁻¹¹ and 1.64522 × 10⁻⁴). The right panel indicates the quantification of the severity of DSS-induced acute colitis. H H&E-stained histological sections of colons (n = 6 mice, p = 3.35138 × 10⁻¹⁰, 9.89870 × 10−1,1.94000 × 10−13 and 8.22848 × 10⁻⁴). The right panel indicates the pathology score of colons from mice in the different treatment groups. I Scanning electron microscopy histological images of colon tissue in each group. DSS-induced acute colitis resulted in loss of goblet cells (white arrows) and intestinal glands (white asterisks) and damaged epithelial cells (white triangles). Treatment with PD-L1-Fc or PD-L1-Fc/Oxi-αCD nanoparticles rescued the loss of goblet cells and intestinal glands and resulted in intact epithelium. J The levels of important inflammatory cytokines (IFN-γ, TNF-α, IL-17A, IL-1β, IL-6 and IL-10) in colonic tissues isolated from healthy or colitis mice treated with different formulations (n = 6 mice). For IFN-γ, p = 3.30000 × 10⁻¹⁴, 4.84904 × 10⁻², 3.30000 × 10⁻¹⁴ and 4.67598 × 10⁻³; For TNF-α, p = 5.14678 × 10⁻⁹, 4.73548 × 10⁻², 2.28100 × 10⁻¹² and 2.02060 × 10⁻³; For IL-1β, p = 3.30000 × 10⁻¹⁴, 2.45742 × 10⁻¹, 3.30000 × 10⁻¹⁴ and 8.59620 × 10⁻³; For IL-17A, p = 1.69100 × 10⁻⁷, 4.16393 × 10⁻¹, 1.94936 × 10⁻¹⁰, 2.16543 × 10⁻² and 9.95935 × 10⁻¹; For IL-6, p = 3.30000 × 10⁻¹⁴, 1.18992 × 10⁻², 3.30000 × 10⁻¹⁴, 1.76390×10⁻² and 1.43236 × 10⁻¹; For IL-10, p = 1.17420 × 10⁻¹¹, 9.97135 × 10⁻¹, 5.10000 × 10⁻¹⁴ and 1.68021 × 10⁻³. Data are presented as mean ± SD. P values derived from One-way ANOVA analysis followed by Tukey’s multiple comparisons test (B, C, F, right panel of G, right panel of H, J). Source data are provided as a Source Data file. NPs nanoparticles.

