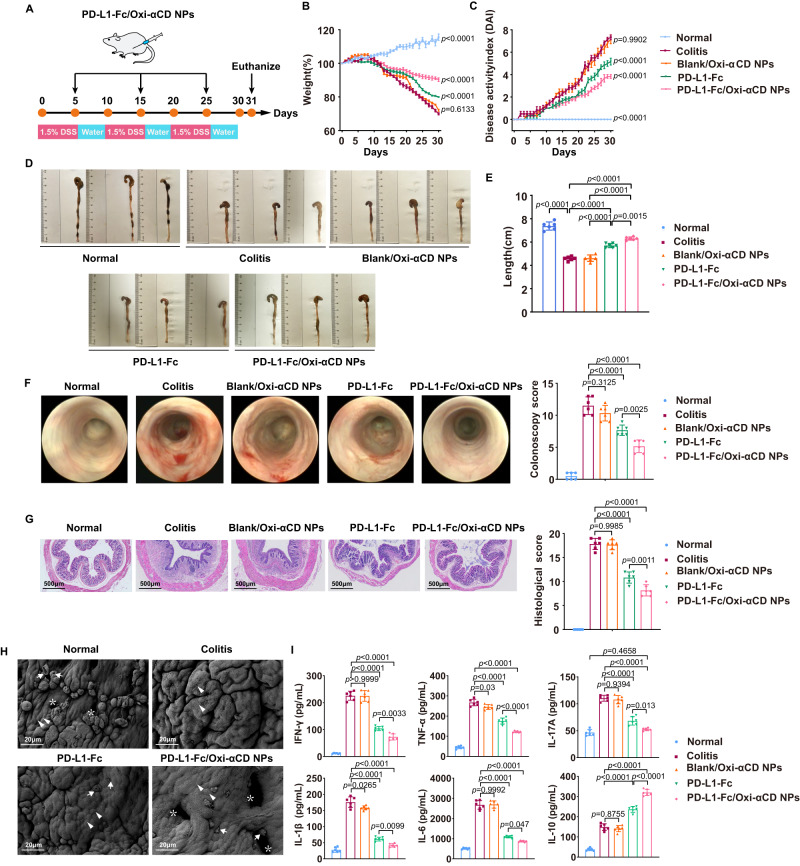
Fig. 4. Effects of PD-L1-Fc versus PD-L1-Fc/Oxi-αCD nanoparticles treatment on the development of DSS-induced chronic colitis.
A Preparation of the chronic colitis model and the protocol for the treatment procedure. Changes in body weight (B) and DAI scores (C) of mice in each group during 32 days of treatment. Comparisons were performed between the colitis group and other groups. In (B), n = 6 mice, p = 3.30000 × 10⁻¹⁴, 6.13254 × 10⁻¹, 4.57936 × 10⁻⁶ and 3.95500 × 10⁻¹². In (C), n = 6 mice, p = 3.30000 × 10⁻¹⁴, 9.90192 × 10⁻¹, 2.77006 × 10⁻⁵ and 6.09039 × 10⁻⁹. Representative digital photos (D), quantified lengths (E), and mini-endoscopic images (F) of colons from mice in the different treatment groups. In (E), n = 6 mice, p = 3.30000 × 10⁻¹⁴, 1.41468 × 10⁻⁷, 2.40040 × 10⁻¹¹, 2.45988 × 10⁻⁷, 3.66850 × 10⁻¹¹ and 1.49054 × 10⁻³. In (F), n = 6 mice, p = 8.75812 × 10⁻⁶, 3.12454 × 10⁻¹, 8.47678 × 10⁻¹⁰ and 2.47231 × 10⁻³. G H&E-stained histological sections of colons (n = 6 mice, p = 7.94880 × 10⁻¹¹, 9.98476 × 10⁻¹, 9.50000 × 10⁻¹⁴ and 1.05638 × 10⁻³). H Scanning electron microscopy histological images of colon tissue in each group. DSS-induced acute colitis resulted in loss of goblet cells (white arrows) and intestinal glands (white asterisks) and damaged epithelial cells (white triangles). I The levels of inflammatory cytokines (IFN-γ, TNF-α, IL-17A, IL-1β, IL-6 and IL-10) in colonic tissues isolated from healthy or colitis mice treated with different treatments (n = 6 mice). For IFN-γ, p = 1.57000 × 10⁻¹³, 9.99993 × 10⁻¹, 3.30000 × 10⁻¹⁴ and 3.27647 × 10⁻³; For TNF-α, p = 6.02600 × 10⁻¹², 3.00000 × 10⁻², 3.30000 × 10⁻¹⁴ and 2.77366 × 10⁻⁷; For IL-1β, p = 3.30000 × 10⁻¹⁴, 2.65410 × 10⁻², 3.30000 × 10⁻¹⁴ and 9.88879 × 10⁻³; For IL-17A, p = 7.69270 × 10⁻¹¹, 9.39431 × 10⁻¹³, 1.01000 × 10⁻¹³, 1.30598 × 10⁻³ and 4.65849 × 10⁻¹; For IL-6, p = 3.30000 × 10⁻¹⁴, 9.99194 × 10⁻¹, 3.30000 × 10⁻¹⁴ and 4.70035 × 10⁻²; For IL-10, p = 7.08200 × 10⁻¹⁰, 8.75465 × 10⁻¹, 3.30000 × 10⁻¹⁴ and 1.90050 × 10⁻⁹. Data are presented as mean ± SD. P values derived from One-way ANOVA analysis followed by Tukey’s multiple comparisons test (B, C, E, right F, right panel of G, I). Source data are provided as a Source Data file. NPs nanoparticles.

