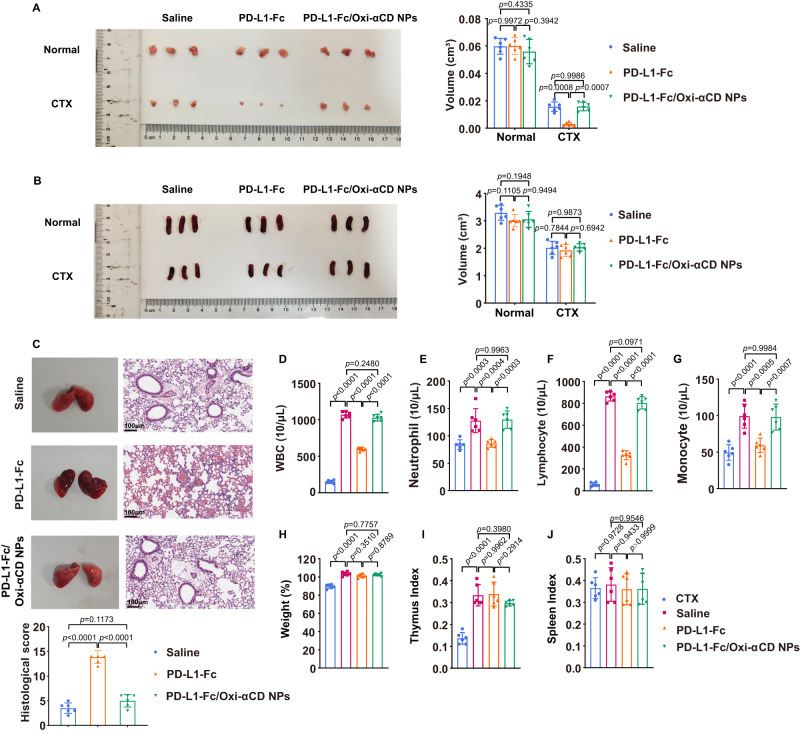
Fig. 7. Evaluation of the side effects of PD-L1-Fc/Oxi-αCD nanoparticles in vivo.
A, B Images of the spleen and thymus from mice treated with the indicated groups. The right panels indicate the volumes of the spleen and thymus from mice in different treatment groups. In (A), p = 9.97186 × 10⁻¹, 4.33501 × 10⁻¹, 3.94221 × 10⁻¹, 8.22806 × 10⁻⁴, 9.98648 × 10⁻¹ and 7.18600 × 10⁻⁴. In (B), p = 1.10451 × 10⁻¹, 1.94779 × 10⁻¹ and 9.49450 × 10⁻¹, 7.84366 × 10⁻¹, 9.87280 × 10⁻¹ and 6.94237 × 10⁻¹. C Images and H&E-stained sections of the lung tissues from normal and infected mice with the indicated treatment. The lungs from infected mice showed diffuse alveolar damage (blue arrows), and the infected mice treated with PD-L1-Fc had more alveolar hemorrhage than the infected mice treated with saline and PD-L1-Fc/Oxi-αCD nanoparticles. The histological score of the lung tissue indicates the quantification of the severity of infected lung tissues from mice in different treatment groups (p = 7.58464 × 10⁻¹⁰, 1.17331 × 10⁻¹ and 6.83214 × 10⁻⁹). Routine blood test (D−G), body weight (H) and organ index (I−J) of mice in the indicated groups. In (D), p = 2.30000 × 10⁻¹⁴, 2.80000 × 10⁻¹⁴, 2.48015 × 10⁻¹ and 4.80000 × 10⁻¹⁴. In (E), p = 2.55389 × 10⁻⁴, 4.36049 × 10⁻⁴, 9.96278 × 10⁻¹ and 2.66995 × 10⁻⁴. In (F), p = 2.30000 × 10⁻¹⁴, 3.10000 × 10⁻¹⁴, 9.71271 × 10⁻² and 9.40000 × 10⁻¹⁴. In (G), p = 3.32176 × 10⁻⁵, 4.80545 × 10⁻⁴, 9.98410 × 10⁻¹ and 6.95958 × 10⁻⁴. In (H), p = 5.66120 × 10⁻¹⁰, 3.50953 × 10⁻¹, 7.75738 × 10⁻¹ and 8.78878 × 10⁻¹. In (I), p = 2.08209 × 10⁻⁷, 9.96169 × 10⁻¹, 3.97959 × 10⁻¹ and 2.91408 × 10⁻¹. In (J), p = 9.72792 × 10⁻¹, 9.43307 × 10⁻¹, 9.54551 × 10⁻¹ and 9.99971 × 10⁻¹. All data are presented as mean ± SD (n = 6 mice). P values derived from two-way ANOVA analysis followed by Tukey’s multiple comparisons test (right panel of A, B), or one-way ANOVA analysis followed by Tukey’s multiple comparisons test (bottom panel of C, D−J). Source data are provided as a Source Data file. NPs nanoparticles.

