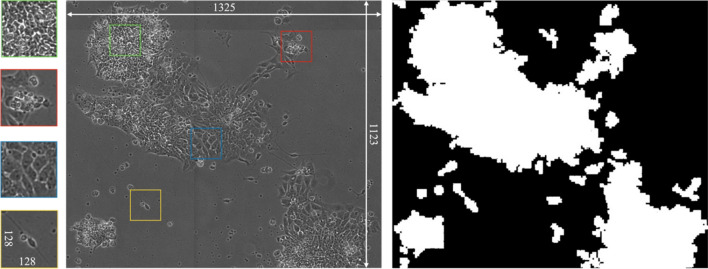
Figure 5.
(Right) Binary map of cell colony area calculated using morphological segmentation. This map is used to reduce the presence of background area when taking image patches. (Center) Example of a large-scale (1325 1123) multi-label image containing areas of each of the individual four classes. (Left) 128 128 patches of images and their corresponding locations within the larger image (from top to bottom: Dense, Debris, Spread, Differentiated). The high background to foreground ratio makes taking random patches from within the binary map of the colony a crucial step in providing relevant information to the model.

