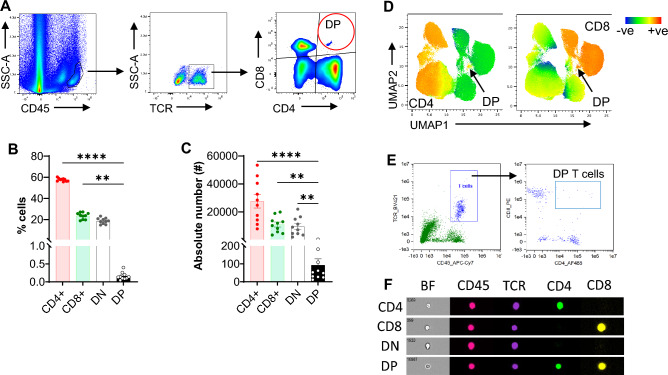
Figure 1.
Kidney DPT cell constitute a minor population in normal mouse kidney and expresses CD4 and CD8 co-receptors on individual cells. (A) Representative flow images showing the gating strategy used to identify DPT cells among CD45+ KMNCs. A total of 1 × 10⁶ KMNCs were stained with anti-CD45, TCR, CD4 and CD8 antibodies and acquired on Cytek Aurora. CD45+ cells were gated and doublets removed using SSC-H versus SSC-W and FSC-H versus FSC-W parameters. Subsequently, Zombie NIR positive dead cells were removed and single live cell population was gated for TCRβ to identify T cells. T cells were then gated for CD4 and CD8 markers to identify different T cell subsets. DPT cells, shown in red circle, were positive for both CD4 and CD8 markers. (B) Graph showing the percentage of DPT cells along with CD4, CD8 and DNT cells in normal mouse kidney (n = 10). (C) Graph showing the absolute numbers of CD4, CD8, DN and DPT cells in normal kidney (n = 10). (D) UMAPs showing expression of CD4 (left UMAP) and CD8 (right UMAP) co-receptors in CD45+TCR+ cells. (E) Dot plots generated using IDEAS software for analyzing AMNIS Imagestream flow data showing the gating strategy used to identify DPT cells (right panel) among kidney T cell population (left panel). (F) Panel showing expression of CD45, TCR, CD4, and CD8 on individual CD4, CD8, DN, and DPT cells. Brightfield images on the leftmost column show individual CD4, CD8, DN, and DPT cells. Data are expressed as mean ± sem and compared by non-parametric Kruskal–Wallis test followed by Dunn’s post-hoc analysis. * = P ≤ 0.05, ** = P ≤ 0.01, **** = P ≤ 0.0001.

