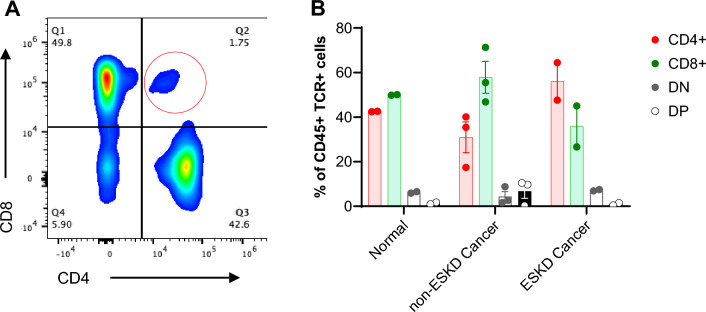
Figure 2.
DPT cells in normal and cancer portion of kidney nephrectomies from renal cell carcinoma (RCC) patients. (A) Representative flow plot showing DPT cells in human kidneys. The gating strategy for human kidneys was identical to mouse kidneys shown in Fig. 1A. A total of 7 human kidney samples were analyzed, consisting of 2 from the adjacent “normal” portion, 2 from the cancer portion of RCC patients with ESRD and 3 samples from RCC patients without ESKD. (B) Graph showing percent DPT cells in normal, non-ESKD cancer and ESKD cancer tissue compared to CD4, CD8 and DNT cells. Data are expressed as median (IQR) and compared by non-parametric Kruskal–Wallis test followed by Dunn’s post-hoc analysis. * = P ≤ 0.05, ** = P ≤ 0.01, *** = P ≤ 0.001, **** = P ≤ 0.0001. BF- Brightfield.

