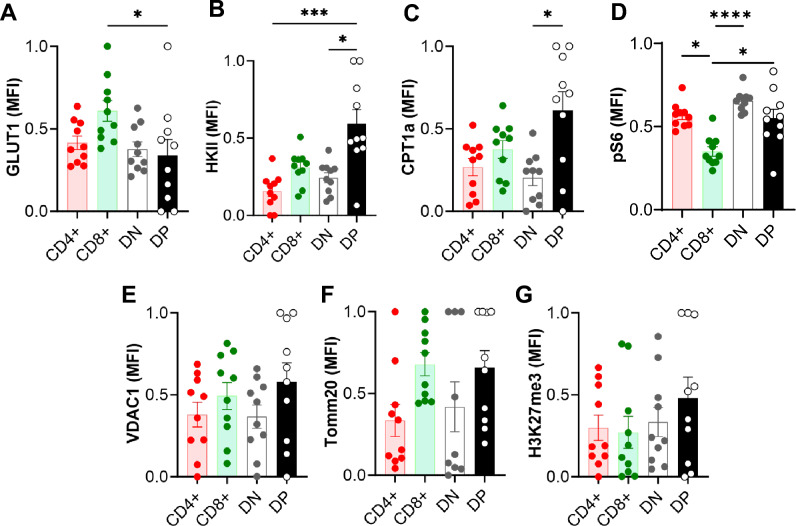
Figure 5.
Kidney DPT cell have a distinct basal metabolic profile compared to CD4, CD8 and DNT cells. (A–G) A total of 1 × 10⁶ KMNCs were stained with Zombie NIR followed by surface markers (CD45, TCR, CD4, CD8) and intracellular markers (GLUT1, HKII, CPT1a, pS6, VDAC1, TOMM20 and H3K27me3) to assess DPT cell metabolism (n = 10). DPT cells had a distinct metabolic profile that was intermediate between CD4 and CD8 T cells. Data are expressed as mean ± sem and compared by non-parametric Kruskal–Wallis test followed by Dunn’s post-hoc analysis. * = P ≤ 0.05, ** = P ≤ 0.01.

