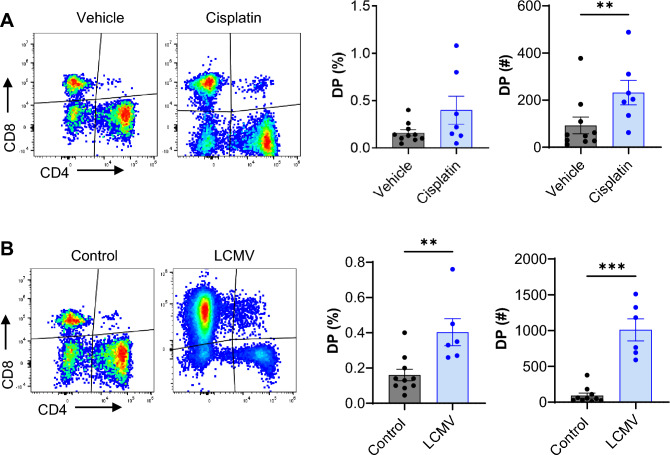
Figure 6.
Kidney DPT cell proportion increase after nephrotoxic injury and viral infection. (A) Percentage (left graph) and absolute numbers (right graph) of DPT cells in vehicle (n = 10) and cisplatin treated (n = 7) mice at 72 h timepoint. (B) Percentage (left graph) and absolute numbers (right graph) of DPT cells in control (n = 10) and LCMV infected (n = 6) mice, 1 week after infection. Data are expressed as mean ± sem and compared by non-parametric Kruskal–Wallis test followed by Dunn’s post-hoc analysis. ** = P ≤ 0.01, *** = P ≤ 0.001.

