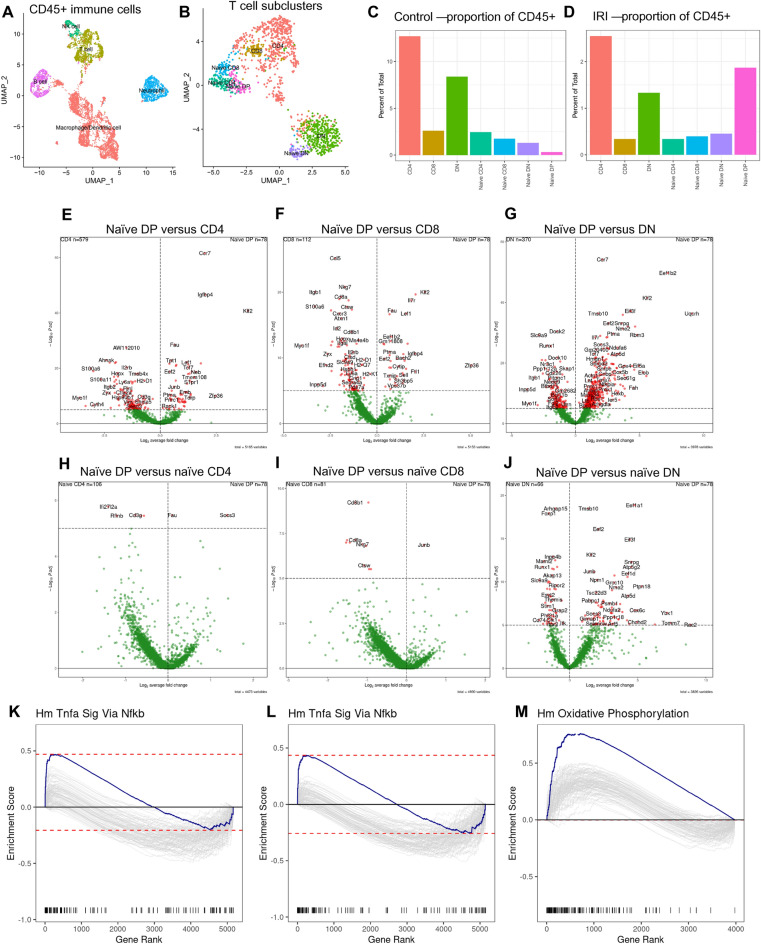
Figure 8.
scRNA-Seq analysis of DPT cells at baseline and 24 h post-IR kidneys of WT mice. CD45+ cells were flow sorted from pooled KMNCs (n = 5/group) and 10,000 cells targeted for 10X Chromium-based encapsulation. (A) UMAP showing major immune cell populations identified in the scRNA-seq data. (B) UMAP showing different T cell populations and the presence of naive DPT cells in WT kidneys. (C and D) Plots showing DPT cell proportions in control and post-IR kidneys. (E–G) Volcano plots showing top differentially expressed genes (DEGs) in naïve DPT cells compared to effector CD4, CD8 and DNT cells, respectively. (H–J) Volcano plots showing top differentially expressed genes (DEGs) in naïve DPT cells compared to naive CD4, CD8 and DNT cells. (K, L) Gene set enrichment analysis (GSEA) of differentially expressed genes (DEGs) in showing increased enrichment of TNFα signaling in DPT cells compared to CD4 and CD8 cells and (M) increased OXPHOS compared to DNT cells.

