Fig. 9.
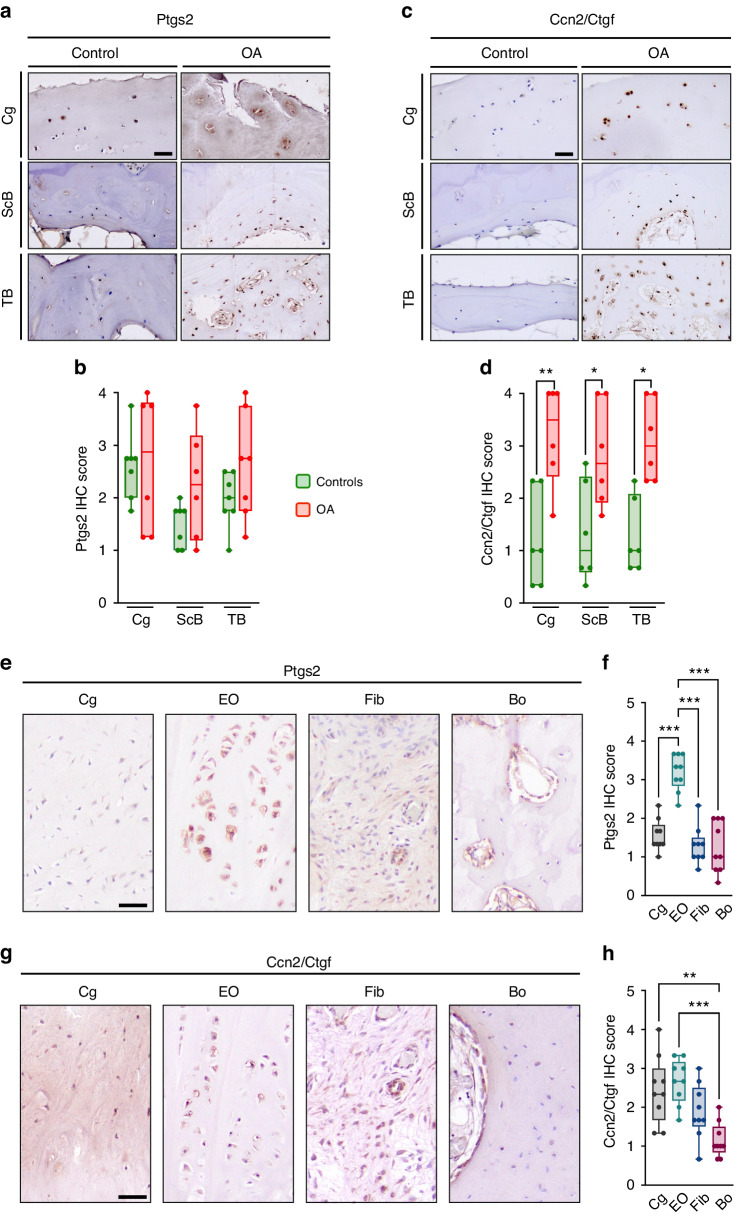
Ptgs2 and Ccn2/Ctgf are expressed in human osteophytes. a Representative histological images of femoral head sections stained for Ptgs2 by immunohistochemistry, scale bar: 50 µm. b Quantification of Ptgs2 expression in the articular cartilage, subchondral bone, and trabecular bone. c Representative histological images of femoral head sections stained for Ccn2/Ctgf by immunohistochemistry, scale bar: 50 µm. d Quantification of Ccn2/Ctgf expression in the articular cartilage, subchondral bone, and trabecular bone (n ≥ 8). e Representative histological images of human osteophyte sections stained for Ptgs2 by immunohistochemistry, scale bar: 50 µm. f Quantification of Ptgs2 expression in cartilage (Cg), zones of endochondral ossification (EO), fibrotic areas (Fib) and bone (Bo). g Representative histological images of human osteophyte sections stained for Ccn2/Ctgf by immunohistochemistry, scale bar: 50 µm. h Quantification of Ccn2/Ctgf expression in cartilage (Cg), zones of endochondral ossification (EO), fibrotic areas (Fib) and bone (Bo) (n ≥ 8). Statistical analysis was conducted with Student’s t test comparing control and OA samples (b, d), or with one-way ANOVA (Tukey) (f, h), *P < 0.05, **P < 0.01, ***P < 0.001

