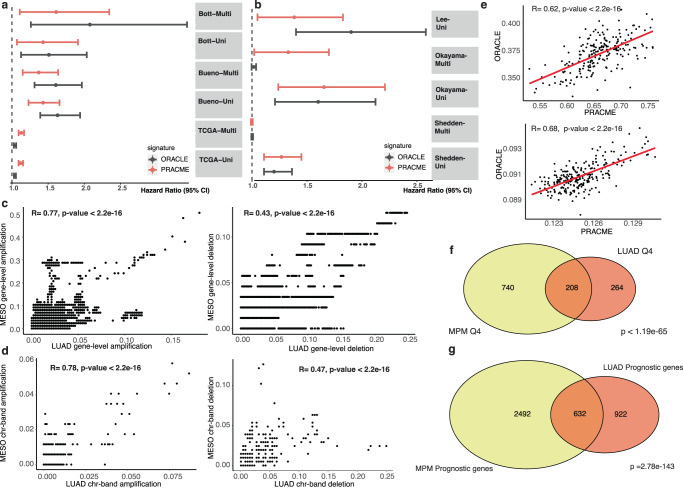
Fig. 5. PRACME and ORACLE signatures are correlated and prognostic in both MPM and LUAD.
a Univariable and Multivariable Cox regression models on Bueno, Bott and TCGA MPM datasets. b Univariable and Multivariable Cox regression models on Lee, Okayama and Shedden datasets; Each segment represents hazard ratio and 95-percent confidence interval. Red indicates PRACME, black indicates ORACLE. Vertical dash-line represents hazard ratio of 1.0. c Gene-level copy number variation correlation with amplification frequency on the left and deletion frequency on the right. X-axis represents LUAD gene-level CNV and y-axis represents MESO gene-level CNV. d Chromosome-band level CNV correlation with amplification frequency on the left panel and deletion frequency on the right panel. e Correlation of PRACME and ORACLE in Bueno MPM patients (top) and Okayama LUAD patients (bottom). f Overlapping Q4 genes in MESO (yellow) and in LUAD (red). g Overlapping prognostic genes in TCGA-MESO (yellow) and TCGA-LUAD (red).

