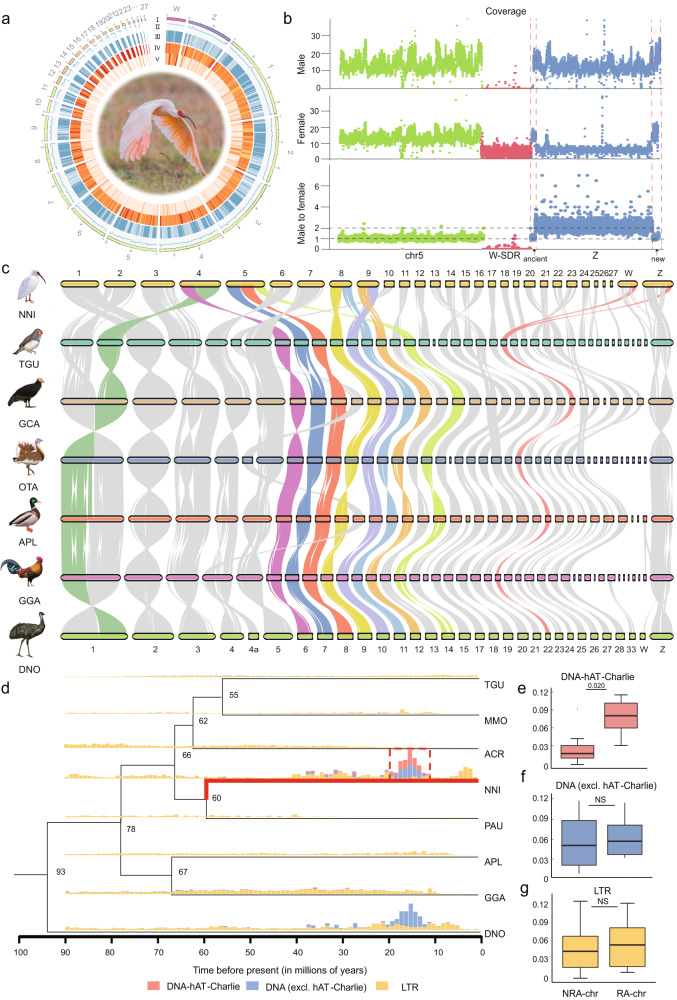
Fig. 1. Genomic comparisons between the crested ibis and other avian species.
a Circos plot of the crested ibis genome. This plot displays I: karyotype; II: GC percent; III: SNP density; IV: gene density; V: repeat sequence density. b Illumina sequencing coverage from a male and a female over the Z and W (using chromosome 5 as a reference). Sequencing coverage was calculated per 10-kb window (dot). The arrows point to the two PARs (ancient and new-PAR). c Pairwise whole-genome alignments across 7 bird genomes. Chromosome IDs of crested ibis (NNI) and emu (DNO) are labeled at the top and bottom of each bar, respectively. Rearranged chromosomes are highlighted in different colors. d Comparison of the insertion history of TEs among species. Phylogeny of eight bird species shows divergence times (denoted at the nodes). MMO: monk parakeet (Myiopsitta monachus); ACR: golden eagle (Aquila chrysaetos); PAU: double-crested cormorant (Phalacrocorax auritus). Vertical bars show the frequency of TE insertions during the evolution of bird species. e–g Contents of DNA-hAT-Charlie, DNA (excluding hAT-Charlie), LTR in non-rearranged (NRA-chr), and rearranged chromosomes (RA-chr). Rearranged chromosomes in this context refer to the chromosomes with observed fusion events. n = 6 and 7 for NRA-chr and RA-chr, respectively. In order to avoid deviations caused by TE characteristics between micro- and macrochromosomes, only chromosomes with lengths longer than 20 Mb were used for statistics. The number on the horizontal line above each two boxes represents p-values (two-sided t-test). NS indicates no significant difference between the two groups of data. The line in the middle of box represents the median, the upper and lower boundaries of the box are the upper and lower quartiles, respectively. The boundaries of the upper and lower whiskers are the maxima and minima, respectively. Source data are provided as a Source Data file.

