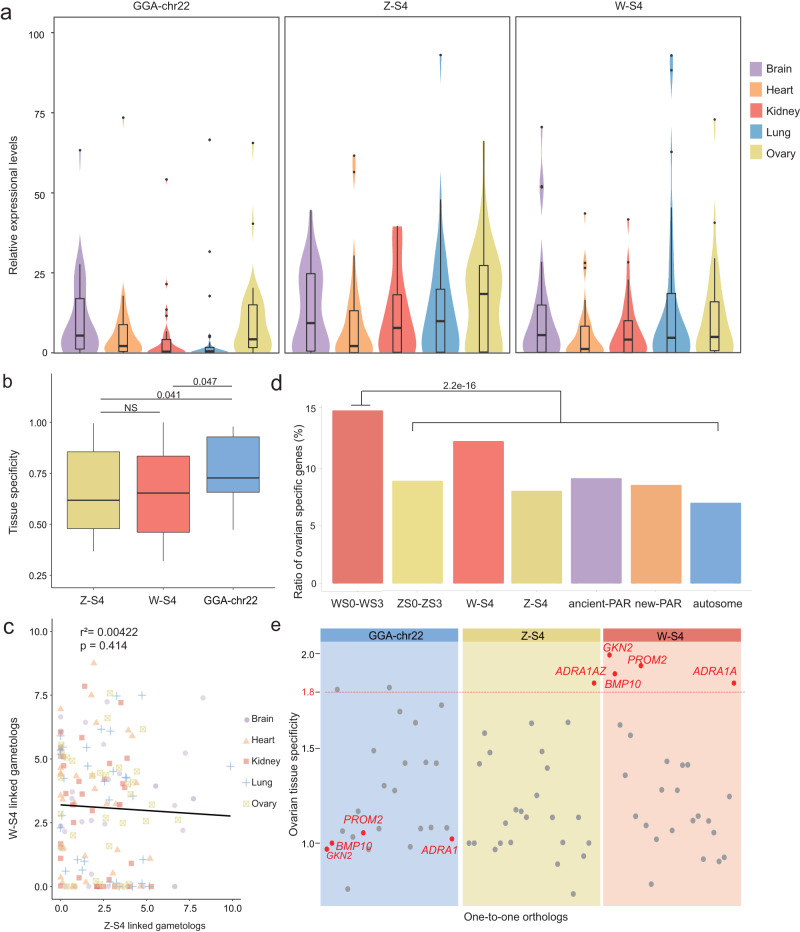
Fig. 3. Shifted gene expression patterns of the added-sex chromosomes of the crested ibis.
a Expression of Z-S4/W-S4 genes and their one-to-one orthologs from chromosome 22 of the chicken in different tissues. The number of orthologous genes is 28 for each group. b Tissue specificity (tested by Tau value) for Z-S4/W-S4 genes and their orthologs from chromosome 22 of the chicken. The number of orthologous genes is 25 for each group. The number on the horizontal line above every two boxes represents p-values (two-sided Wilcoxon signed rank test). The line in the middle of box represents the median of this set of data, the upper and lower boundaries of the box are the upper and lower quartiles, respectively. The boundaries of the upper and lower whiskers are the maxima and minima, respectively. c The X- and Y-axis show the expression of Z-S4 and W-S4 linked gametologs in different tissues, respectively, which is measured by log2(1 + FPKM). Linear regression was used with adjustments. The line represents the regression relationship between the expression of the Z and W genes. d Ratio of ovarian-specific genes in each region of the genome. Chi-Squared Test was used (χ2 = 26.564; P = 2.2e-16). e Ovarian tissue specificity of orthologs between Z-S4/W-S4 linked and chromosome 22 of the chicken. Genes above the red line show ovarian-specific expression patterns, with a Tau value higher than 0.8 and expressed mostly in the ovaries. Source data are provided as a Source Data file.

