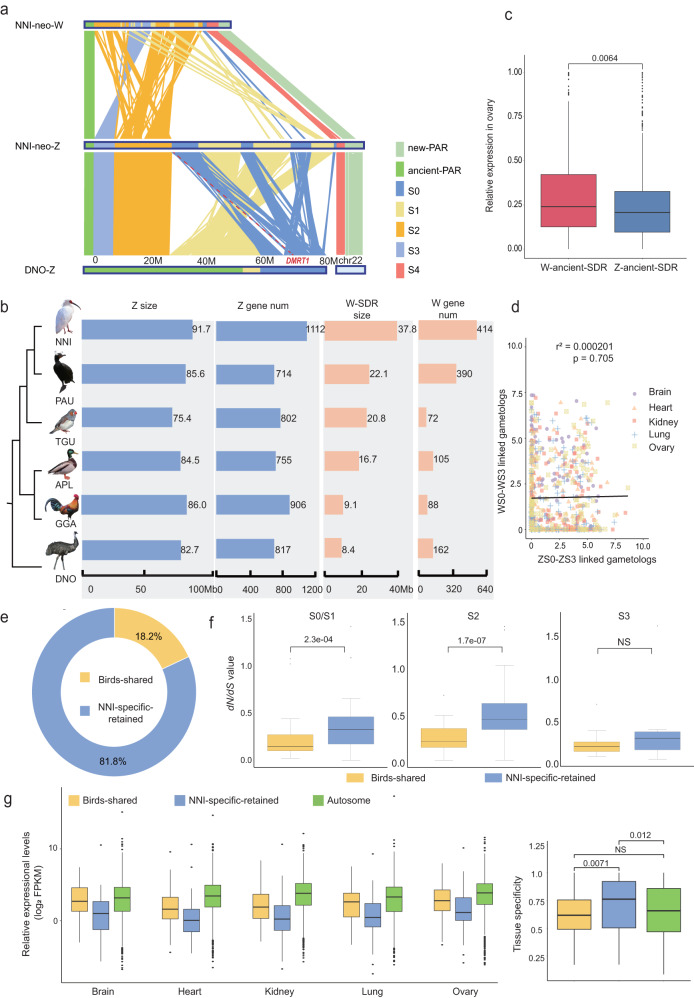
Fig. 4. Highly restricted degeneration and female-biased expression of the ancient-W in the crested ibis.
a Syntenic plot between the neo-Z and neo-W Chromosomes of the crested ibis and homologous chromosomes (Z and chromosome 22) of the emu. Each line represents one pair of aligned fragments, and each color corresponds to one evolutionary stratum. The emu strata are demarcated according to Liu et al.21. b Lengths and gene number of Z and W chromosomes across the studied bird species. c Expression in the ovary of Z- and W- linked genes on the ancient-SDR. n = 294 for genes of W-ancient-SDR, n = 734 for genes of Z-ancient-SDR. Two-sided Wilcoxon signed rank test was used. d The X- and Y-axis show the expression of Z- and W-linked gametologs in S0–S3, respectively. The solid line represents the regression relation between the expressions of the Z and W. Linear regression test with adjustments was used. e Proportion of the two groups of genes to all ovary-biased genes. f Comparison of the dN/dS values for the two groups of genes in the different strata. n = 39 and 65 for S0/S1 genes of Birds-shared group and NNI-specific-retained group; n = 36 and 72 for S2 genes of Birds-shared group and NNI-specific-retained group; n = 10 and 18 for S3 genes of Birds-shared group and NNI-specific-retained group. Two-sided Wilcoxon signed rank test was used. g Left: Expression for two groups of genes on the ancient-SDR of the W and autosomes in different tissues. Right: Tissue specificity for two groups of genes on the ancient-SDR of the W and autosomes in different tissues. n = 89, 132, and 1273 for genes of Bird-shared group, NNI-specific-retained group, and Autosome group (chr1 was taken as example), respectively. The line in the middle of box represents the median of this set of data, the upper and lower boundaries of the box are the upper and lower quartiles, respectively. The boundaries of the upper and lower whiskers are the maxima and minima, respectively. Data statistical test was used two-sided Wilcoxon signed rank. Source data are provided as a Source Data file.

