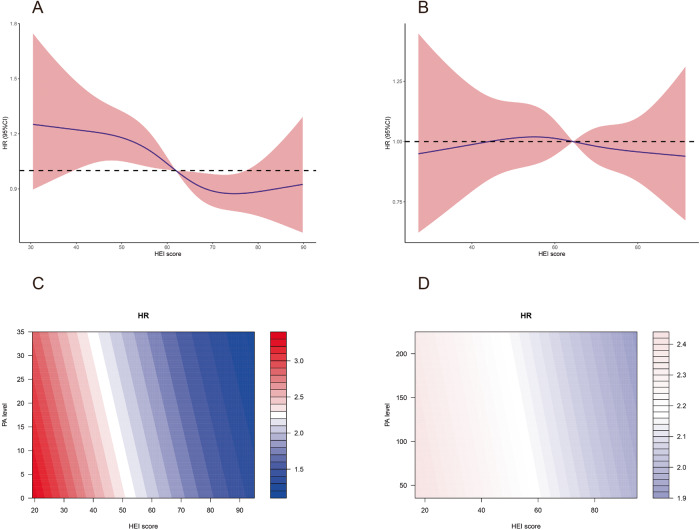
Fig. 2. The association between HEI scores and the risk of all-cause mortality of MAFLD grouped by PA.
A In PA inactive group, restricted cubic splines showed the HR for all-cause mortality reduced with the increase of HEI scores. B In PA active group, restricted cubic splines showed the HR for all-cause mortality was not significantly changed over HEI scores. C Contour plot of PA inactive group. D Contour plot of PA active group. The color refers to the HR level. C and D showed the difference of HRs was significant in PA inactive group but not the active group.

