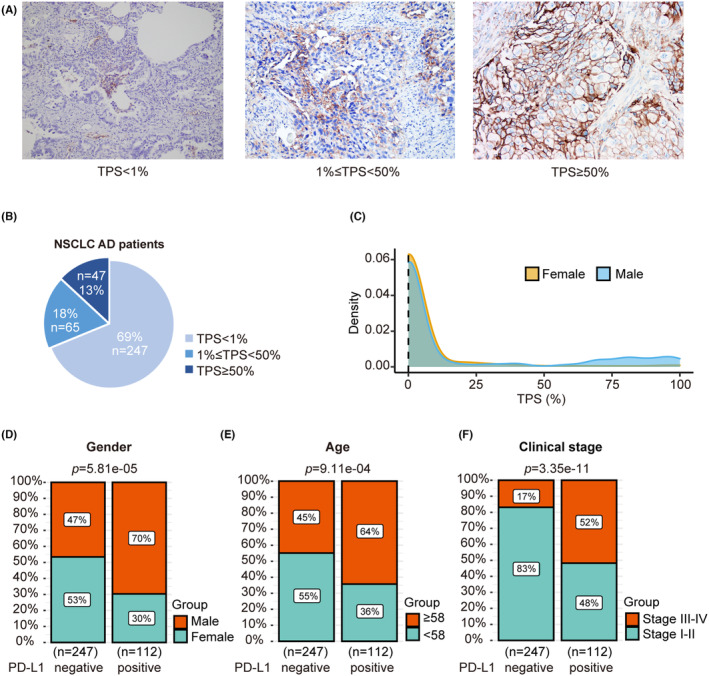
FIGURE 1.

Correlation between PD‐L1 expression and clinical characteristics in the NSCLC AD cohort. (A) PD‐L1 immunohistochemical staining of TPS levels from low to high. (B) PD‐L1 expression in patients with NSCLC AD. (C) Distribution of PD‐L1 expression levels in males and females. (D) Comparison of gender distribution on PD‐L1‐negative and positive subgroups (p = 5.81E‐5). (E) Comparison of age distribution on PD‐L1 negative and positive subgroups (p = 9.11E‐4). (F) Comparison of clinical stages on PD‐L1 negative and positive subgroups (p = 3.35E‐11).
