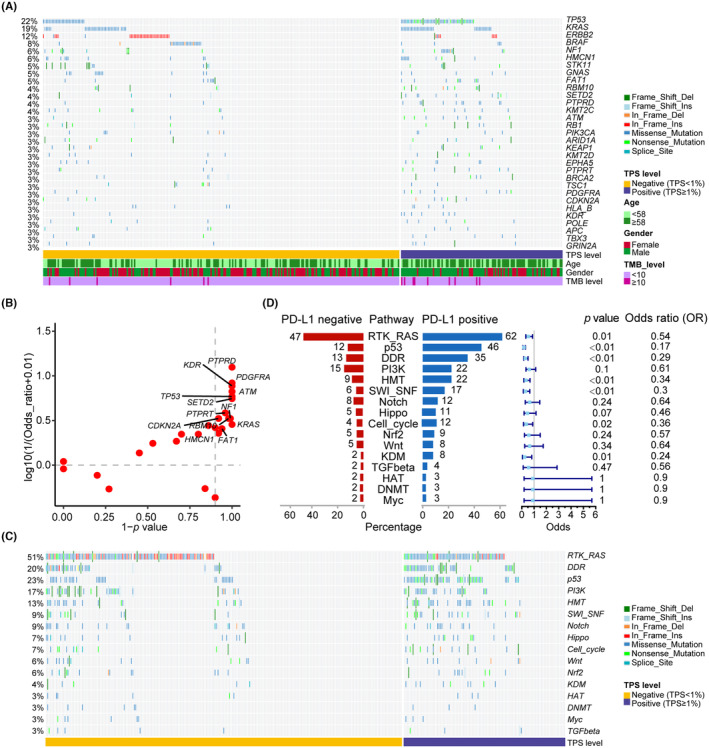
FIGURE 3.

Gene and pathway alterations in different PD‐L1 expression levels in the NSCLC AD cohort. (A) The altered landscape of genes with population frequencies greater than or equal to 3% and in PD‐L1 positive and negative groups. (B) The scatter plot of the altered genes with population frequencies greater than or equal to 3% and in PD‐L1 positive and negative groups. (C) The altered landscape of tumor alterations harboring pathways in PD‐L1 positive and negative groups. (D) Population percentage and forest plot of tumor alterations harboring pathways in PD‐L1 positive and negative groups.
